
Greater Phoenix Housing Market June 2026: Affordability Improves as Buyers Gain Leverage
Greater Phoenix Housing Market June 2026:
Affordability Improves as Buyers Gain Leverage
Rates haven't fallen. Prices haven't dropped. Yet income growth, steady financing, and a wave of builder incentives are quietly reshaping affordability across the Valley. Here is the complete picture — every segment, every major city, and exactly what to do next.
For nearly two years, almost every conversation about the Phoenix housing market has centered on one thing: affordability. Higher rates, rising prices, and inflation combined to make homeownership feel like it was working against buyers at every turn.
This month, a different story is starting to emerge — and it's not because rates suddenly dropped or prices got cheap.
Arizona recently ranked seventh in the nation for personal income growth, with employment earnings up 5.7%, comfortably ahead of inflation. Home values across much of Greater Phoenix have held relatively flat for nearly two years, and mortgage rates have spent the past month holding in the mid-6% range rather than climbing higher. None of these changes dramatically improves affordability on its own. Together, they've created a meaningfully different environment than buyers faced a year ago.
Seller concessions remain common, rate buydowns are widely available, and buyers can once again negotiate repairs and closing costs without fear of losing the home to another offer.
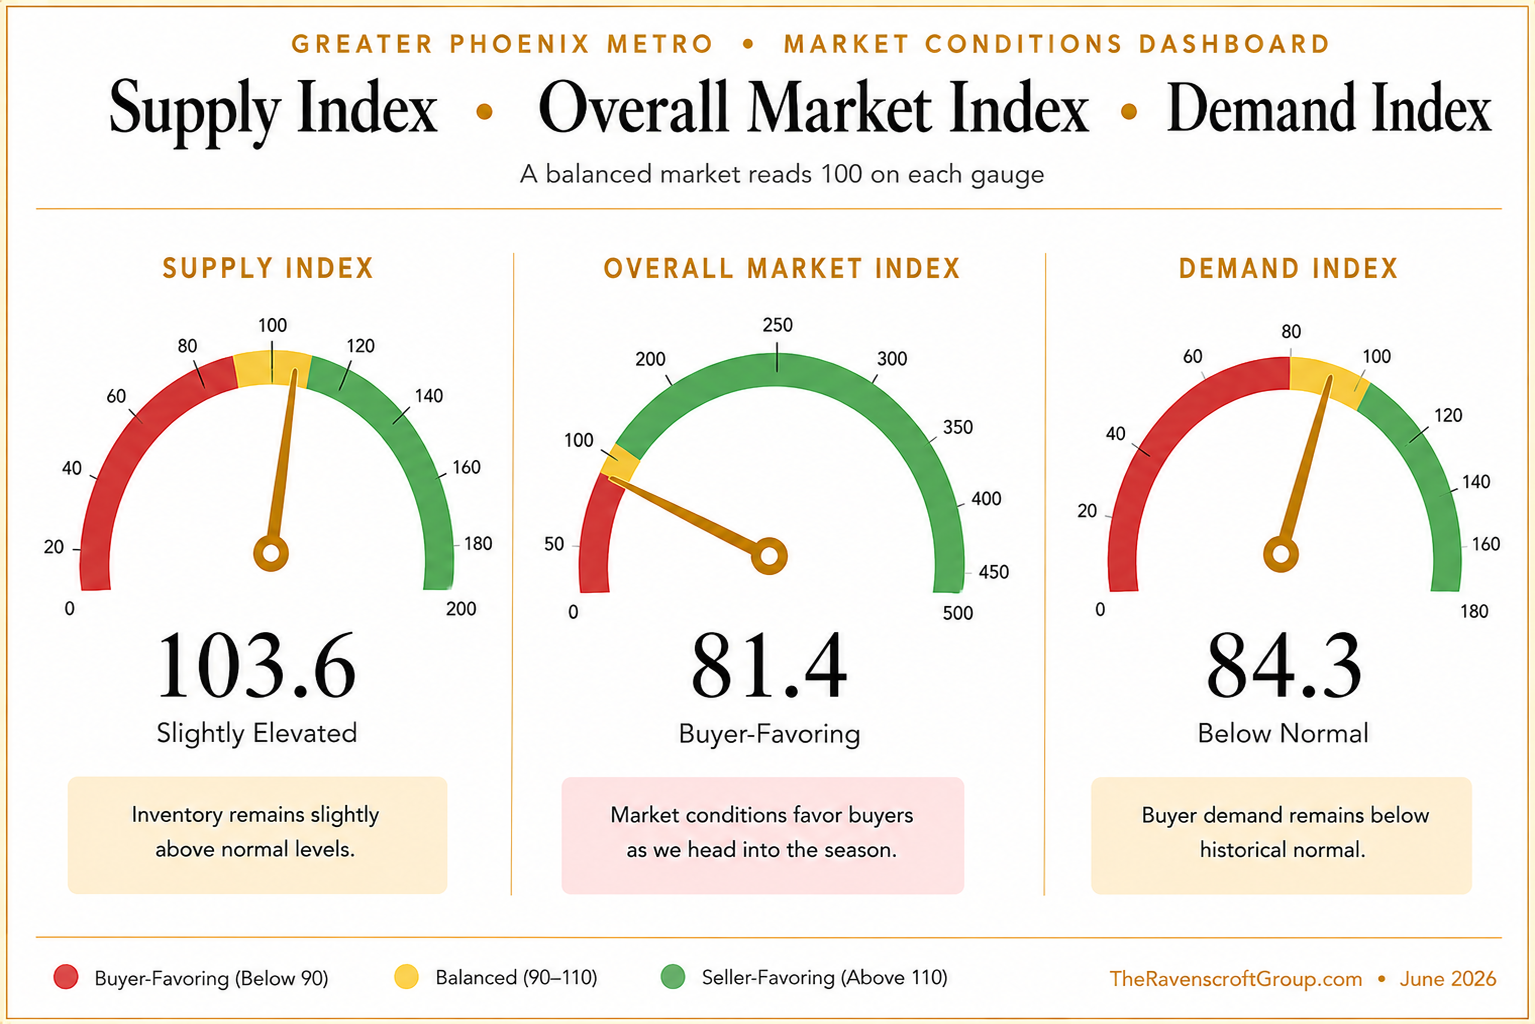
02 The Market Still Favors Buyers
Greater Phoenix remains a buyer's market with an Overall Market Index of 81.4. At first glance it's tempting to assume that's from excess inventory — but the data tells a different story. The Supply Index sits at 103.6, only slightly above balanced, while the Demand Index remains soft at 84.3.
In other words: today's buyer-friendly conditions aren't being driven by too many homes on the market. They're being driven by demand that hasn't fully recovered since rates moved higher in recent years. Sellers remain willing to negotiate on price, contribute to closing costs, offer rate buydowns, and complete repairs that would have been unthinkable during 2021–2022.
Contract activity is still running ahead of last year's pace, though. Buyers haven't disappeared — they're simply being more deliberate, comparing more properties, and making decisions based on long-term value instead of urgency.
Overall market position — seller vs. buyer leverage
Overall Market Index of 81.4 places Greater Phoenix firmly in buyer-favorable territory metro-wide. Conditions vary significantly by submarket and price point — see city breakdown below.
03 Home Prices: Two Different Markets
One trend has continued throughout 2026: the separation between price points. Homes below roughly $500,000 have generally experienced modest price declines from their peak values, while homes between $500,000 and $1 million have remained remarkably stable.
The luxury market continues telling a different story. Properties above $1 million moved beyond their 2022 pricing peak some time ago and continue showing strength in many parts of the Valley. Higher-income buyers, larger down payments, and cash purchases have made this segment considerably less sensitive to mortgage rates than the broader market.
Understanding which market you're buying or selling into has never mattered more — the strategy for a sub-$500K purchase and a $1.5M luxury purchase are almost entirely different conversations.
04 The National Backdrop: Rates & Migration
Zooming out from the Valley helps explain why this summer feels different. Two national and regional data points are worth understanding if you're weighing a purchase, sale, or investment right now.
Freddie Mac's Primary Mortgage Market Survey has the 30-year fixed rate holding in a narrow band through most of 2026 — generally between 6.4% and 6.6%, and running noticeably below the 6.77% average recorded a year earlier. Rates haven't collapsed, but the stability has mattered: it's given lenders room to keep offering buydowns and given buyers more confidence to act.
Net international migration slowed sharply nationwide in 2025, and Maricopa County felt that too — but domestic migration into the Valley strengthened enough to more than offset the pullback. Maricopa County added roughly 57,000 residents last year, the fifth-largest county-level gain in the country, and Arizona's population is projected to top 7.7 million in 2026. That's a healthier, more durable demand signal than a wave driven primarily by international arrivals. If you're one of the many relocating from out of state, my Moving to Arizona guide and Out-of-State Buyer's Guide to Phoenix Metro both walk through what to expect.
05 Summer Seasonality
Every year around this time, people start asking whether the market is losing momentum. The honest answer is yes — but that's exactly what happens almost every summer, as school lets out and families travel around Memorial Day, the Fourth of July, and Labor Day.
What's encouraging this year is that despite the slower months, buyer demand continues to outperform last year's pace. Buyers have simply become more selective — comparing more homes, negotiating harder, and placing greater weight on value.
Homes that are priced appropriately and presented well continue attracting strong interest. Homes that miss the mark are sitting longer and often requiring price adjustments before finding a buyer.
06 New Construction & Investor Financing
For most of the past two years, builder incentives targeted owner-occupied buyers through rate buydowns and closing cost assistance. That's changing — builders are now getting aggressive with investors too. Investor financing has historically carried much higher rates than owner-occupied loans, making new construction hard to justify against resale. That's shifted: I've recently seen investor rates as low as 3.75% on select inventory homes — a fundamentally different conversation than a year ago. I break down exactly which builders and communities are offering these rates in New Construction Investor Rates 2026.
Why it's worth another look
On select builder inventory homes
Paired with predictable maintenance, builder warranties, modern efficiency, and lower capex in the early years of ownership.
Still worth evaluating carefully
Rental restrictions vary by community
Purchase price relative to resale comps, location, and long-term rental demand all remain critical before committing.
I've worked with several investors this year who initially planned on resale homes — after comparing financing, maintenance, tax strategy, and projected cash flow, they chose new construction because the numbers simply made more sense. That wasn't a common conversation a year ago. Today, it's becoming routine. If short-term or vacation rental income is part of your strategy, my Short-Term Rentals & Vacation Homes page covers eligible submarkets and STR-friendly zoning across the Valley.
The One Big Beautiful Bill Act, signed into law in July 2025, permanently restored 100% bonus depreciation for qualifying property placed in service after January 19, 2025 — reversing the phase-down that had been scheduled to fully sunset by 2027. The IRS followed up in January 2026 with Notice 2026-11, clarifying how investors apply the rule. Paired with a cost segregation study, many components of a new investment property can be deducted in full in year one rather than spread across a 27.5- or 39-year schedule. I've written a full breakdown at Bonus Depreciation for Real Estate in 2026, along with deeper dives into depreciation, 1031 exchanges & step-up in basis and real-world tax strategy scenarios for 2026. Always confirm specifics with your CPA.
07 The Rental Market's Ongoing Correction
The Greater Phoenix apartment market continues moving through the correction many economists expected following the 2021–2023 construction boom. More than 25,000 units delivered over the past year pushed vacancy higher, and concessions have become common as operators work to maintain occupancy.
The encouraging part: multifamily permits have fallen sharply as new projects stop penciling out financially — the first real step toward rebalancing supply and demand. Most forecasts point to late 2026 or early 2027 as the point where year-over-year rent growth turns positive again, though the recovery won't look the same everywhere.
North Scottsdale, North Phoenix, and much of the East Valley are best positioned thanks to higher household incomes and strong healthcare and tech employment. Downtown Phoenix, Tempe, and the Southwest Valley absorbed the heaviest new supply and will likely take longer to tighten. For landlords and investors weighing their options, my Phoenix Rental Strategy Guide (LTR vs. MTR vs. STR) breaks down which model performs best by submarket.
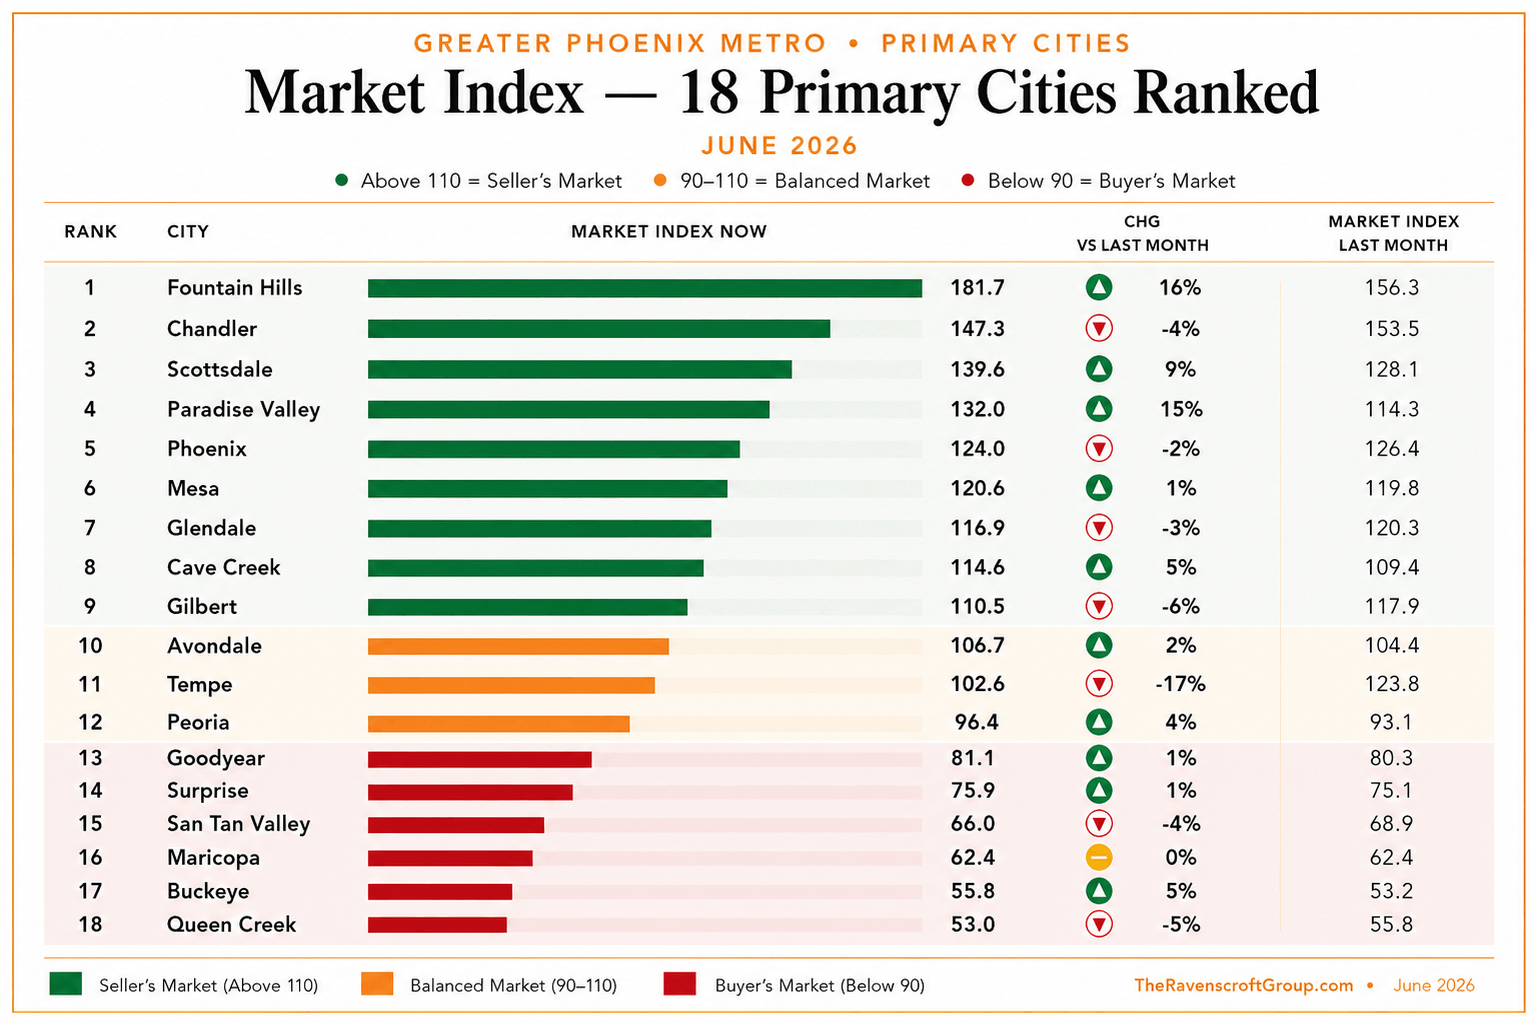
08 City-by-City Breakdown
There isn't really a single "Phoenix market," and this month's data makes that clearer than usual. Two buyers shopping the same price point can have completely different experiences depending on where they're looking.
| City / Area | Conditions | What's Happening |
|---|---|---|
| Fountain Hills | Seller | Index 181.7 — up 16% this month. One of the strongest seller's markets in the Valley. |
| Paradise Valley | Seller | Significant improvement. Ultra-luxury demand continues to anchor the segment. |
| Scottsdale | Seller | Up nearly 9% — continuing the momentum seen throughout the luxury market this year. |
| Chandler | Balanced | One of the healthiest balanced markets in the Valley. Tech corridor demand remains steady. |
| Gilbert | Balanced | Relatively stable conditions across most price points. |
| Phoenix (parts of) | Balanced | Relatively stable, though conditions vary meaningfully by submarket. |
| Tempe | Buyer | Down 17% — the largest shift toward buyers of any city this month. |
| Goodyear / Surprise | Buyer | Strong negotiating leverage. Builder competition keeps concessions aggressive. |
| Buckeye | Buyer | Considerable buyer leverage with strong price-per-square-foot value. |
| Queen Creek / San Tan | Buyer | Outer-market flexibility with active new construction incentives. |
| Maricopa | Buyer | Best combination of price, square footage, and negotiating room in the metro. |
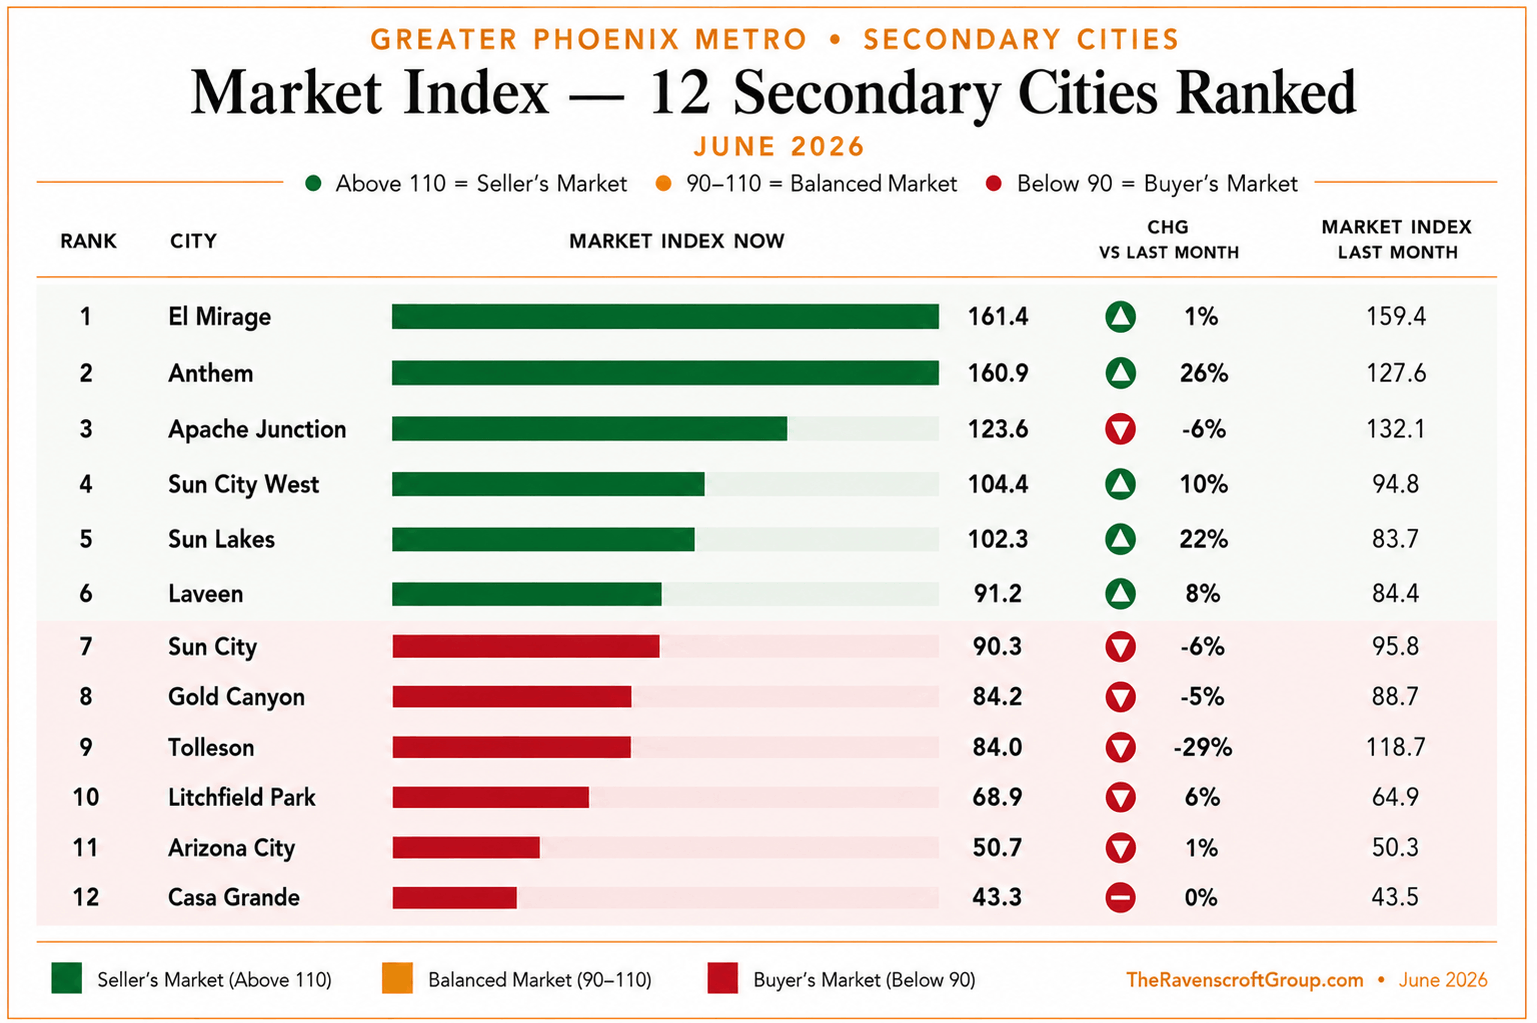
The secondary markets add another layer — and because they see more month-to-month volatility from lower transaction volume, they often provide an early look at where local conditions are changing. Anthem and Sun Lakes strengthened notably toward sellers this month, while Tolleson moved further toward buyers. Gold Canyon, Sun City, Casa Grande, Litchfield Park, and Florence continue to move independently of the larger metro trends.
09 Guidance: Buyers · Sellers · Investors
The market looks different depending on what you're trying to accomplish. Here's the practical breakdown for each situation.
Today's market continues rewarding preparation and patience. Buyers have more negotiating power than they've had in several years, and many sellers are willing to contribute toward closing costs, repairs, or temporary rate buydowns to get a transaction across the finish line.
Ask for a rate buydown on every offer. A seller-paid buydown often costs less than a comparable price reduction and can meaningfully lower your effective rate in year one, while keeping the seller's headline price intact. Run your own numbers with my Helpful Calculators before you write an offer.
Your leverage is highest in the outer markets. Buckeye, Goodyear, Surprise, Queen Creek, Maricopa, and San Tan Valley are giving buyers the most room to negotiate right now.
Strong moves for buyers right now
- Ask for a seller-paid rate buydown on every offer
- Compare builder financing incentives against resale on total monthly cost, not just list price
- If you're planning to stay 5+ years, today's environment rewards patience over urgency
- Investors: don't overlook new construction financing before defaulting to resale
Buyers have choices today, which makes pricing the most important decision a seller will make. Homes that enter the market priced appropriately generate stronger interest, spend less time on market, and require fewer reductions than homes that start high and chase the market down.
Presentation still separates winners from sitters. Professional photography, thoughtful staging, and addressing deferred maintenance before listing continue to matter as much as ever. My full Listing Strategy walks through exactly how I position and market every home.
Know your specific submarket. Sellers in Fountain Hills or Scottsdale should approach pricing very differently than sellers in Buckeye or Goodyear.
What's working
- Priced realistically from day one against recent comparable sales
- Professional staging and photography — non-negotiable in today's market
- Offering a rate buydown or closing cost credit to widen the buyer pool
New construction deserves a fresh look this year. Builder incentives, competitive investor financing, and the permanent return of 100% bonus depreciation are combining to create opportunities that simply didn't pencil out a year ago.
Run the full comparison. Financing, maintenance costs, tax strategy, and projected cash flow should all be weighed side-by-side against resale before assuming either option is automatically better. See real examples of how this has played out for past clients in my Client Wins & Case Studies.
Migration remains a durable tailwind. Domestic in-migration into Maricopa County strengthened even as international migration slowed nationally — a healthier long-term demand signal for rental and resale demand alike.
Best plays right now
- Compare new-construction investor financing (as low as 3.75% on select inventory) against resale
- Pair acquisitions with a cost segregation study to maximize year-one bonus depreciation
- Watch rental restrictions and HOA policy carefully — they vary significantly by community
10 Looking Ahead
As we move into the second half of the year, mortgage rates remain the biggest variable influencing buyer activity. Last year, rates moved lower during late summer before demand accelerated heading into fall — if that pattern repeats, today's buyers may face more competition than they're experiencing right now.
The market isn't perfect, and it rarely is. But it's becoming more balanced, more predictable, and easier to navigate than it has been in quite some time.
Additional Reading & Resources
A few more resources if you're weighing a specific move — buying, selling, investing, or relocating to Greater Phoenix.
Explore & Guides
More From the Blog

Written by
Real Estate Advisor · Owner, The Ravenscroft Group · Elite Agent, Real Broker · License SA691304000
Eric Ravenscroft is a Top 1% real estate advisor across North America and the owner of The Ravenscroft Group at Real Broker. A former Director of Wealth Management, Eric brings a rare financial planning lens to every transaction — specializing in new construction, short-term rental investment, 1031 exchanges, and California-to-Arizona relocation strategy. He has closed more than $100 million in residential sales, helped clients build over $133 million in long-term wealth, and earned 150+ five-star reviews. Eric has been featured in the Wall Street Journal and is a preferred partner for USAA, Chase, SoFi, PennyMac, Citibank, and RBC.
Market statistics represent metro-wide averages as of June 30, 2026; individual submarket conditions vary. Overall/Supply/Demand Index and city-by-city figures reflect ARMLS data via Cromford Report methodology. National mortgage rate data via Freddie Mac's Primary Mortgage Market Survey (week ending June 25, 2026). Population and migration figures via the Arizona Office of Economic Opportunity and U.S. Census Bureau estimates, as reported by Axios Phoenix (May 2026). Bonus depreciation details reflect the One Big Beautiful Bill Act (signed July 4, 2025) and IRS Notice 2026-11 (issued January 14, 2026) — consult a qualified CPA before acting. AZ License SA691304000.
Categories
- All Blogs (302)
- Active Adult & 55 Plus Communities (14)
- Arizona Relocation Guides (19)
- Buyers (196)
- Financial Planning (53)
- General Real Estate (127)
- Income From Real Estate (54)
- Market Update (23)
- New Construction (26)
- News, Updates and Coming Soon (56)
- Real Estate Agent Financial Planning (21)
- Real Estate Investing (84)
- Sellers (102)
- Vacation and Short Term Rentals (41)
Recent Posts


About the Author
Eric Ravenscroft is a Top 1% REALTOR® across North America and one of Arizona’s most trusted real estate strategists. With 15 years of experience spanning real estate, wealth management, and investment planning, he helps clients make smarter, financially grounded decisions, from new construction and relocations to STR investments, 1031 exchanges, and long-term portfolio strategy.
Eric’s expertise has earned him industry recognition, Elite status with Real Broker, and features in major publications including the Wall Street Journal, MarketWatch, MSN, and Morningstar. Clients across the Greater Phoenix Metro rely on his clarity, strategic insight, and results-driven guidance.
Ready to make a confident real estate move? Call or text Eric today.