
Build wealth withArizona investment property.
Population growth, rent growth, LTR/STR/MTR strategy, financing, and realistic returns — from a Phoenix-area REALTOR® and former wealth management executive who has helped investors at every level build a portfolio in the Valley.
Real numbers, real deals —
not generic top-10 lists
I've spent the better part of my career sitting on both sides of the investment table. Before I became a REALTOR®, I worked in wealth management, helping high-net-worth clients build diversified portfolios — and real estate was almost always the asset class clients asked about most, yet understood least. Now, as a Phoenix-area REALTOR® specializing in relocation and investment property, I help investors — from first-time house hackers to out-of-state portfolio builders — find, finance, and manage rental property across the Valley.
This guide is the resource I wish existed when I started buying rental property in Arizona myself. It's built from real transactions, real client case studies, and real numbers. Whether you're considering a long-term rental (LTR), a short-term rental (STR), a mid-term rental (MTR), or a house hack to get started, this page is meant to be the only resource you need to open.
Why Arizona, why now —
the fundamentals that matter
Arizona consistently ranks among the top states for real estate investment, and the reasons go well beyond sunshine. As someone who advised clients on macro asset allocation before becoming a REALTOR®, I look at Arizona the way I'd evaluate any investment thesis: supply, demand, demographics, policy environment, and economic diversification.

Population growth &
migration trends
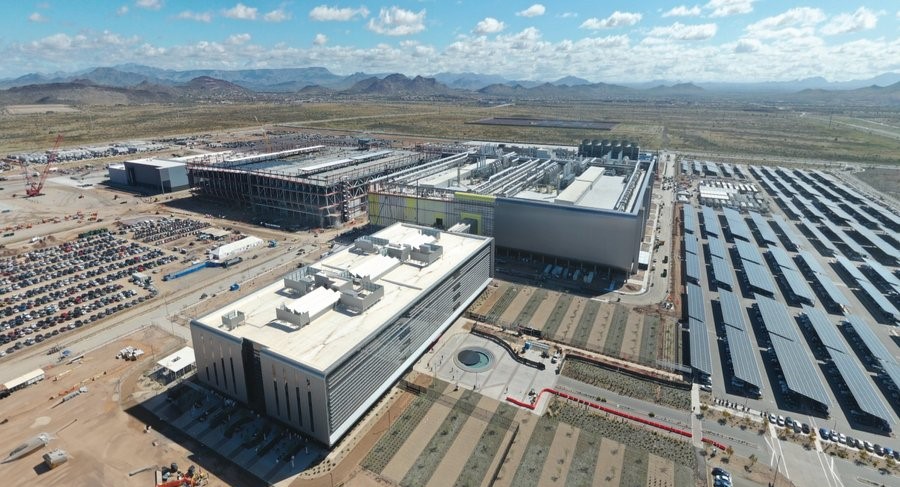
Maricopa County remains the largest single source of numeric population growth among U.S. counties, even as the pace has cooled from its 2021-2022 peak — the county added roughly 35,000 residents in 2025 alone. This isn't a recent pandemic-era blip — it's a multi-decade trend driven by domestic migration from California, Illinois, Washington, and Colorado; international migration, particularly from Mexico and Canada; and natural population growth from a relatively young median age compared to other Sun Belt retirement destinations.
Population growth is the single most important leading indicator for rental demand. More people moving in means more renters competing for housing stock, which supports both occupancy rates and rent growth. When I'm evaluating a submarket for a client, population and job growth trends are the first thing I pull up — before I ever look at a specific property.
Growth isn't uniform across the Valley. The fastest-growing submarkets by percentage are now on the periphery of the metro and just across the county line — the West Valley (Buckeye, Goodyear) and the Pinal County corridor (Queen Creek) — where Pinal County actually outpaced Maricopa's growth rate in the most recent state estimates, even though Maricopa still adds more residents in raw numbers. New home construction is most active in exactly these submarkets.
| City | 2020 Population | Recent Estimate | % Change | Source |
|---|---|---|---|---|
| Buckeye | 93,422 | ~114,300 (2024) | +22.4% | U.S. Census / OEO |
| Goodyear | 95,294 | 118,186 (2024) | +24.0% | U.S. Census |
| Queen Creek | ~64,000 | ~88,000+ (2024) | ~+38% | U.S. Census / OEO |
| Maricopa County (overall) | 4,420,568 | 4,787,790 (2025) | +7.9% | Arizona OEO |
Sources: U.S. Census Bureau 2020 Census & 2024 population estimates; Arizona Office of Economic Opportunity (OEO) 2025 estimates. Queen Creek figures are approximate, spanning the Maricopa/Pinal County line. Figures will continue to shift with each annual estimate — verify current numbers before underwriting a deal.
Rent growth across
Greater Phoenix
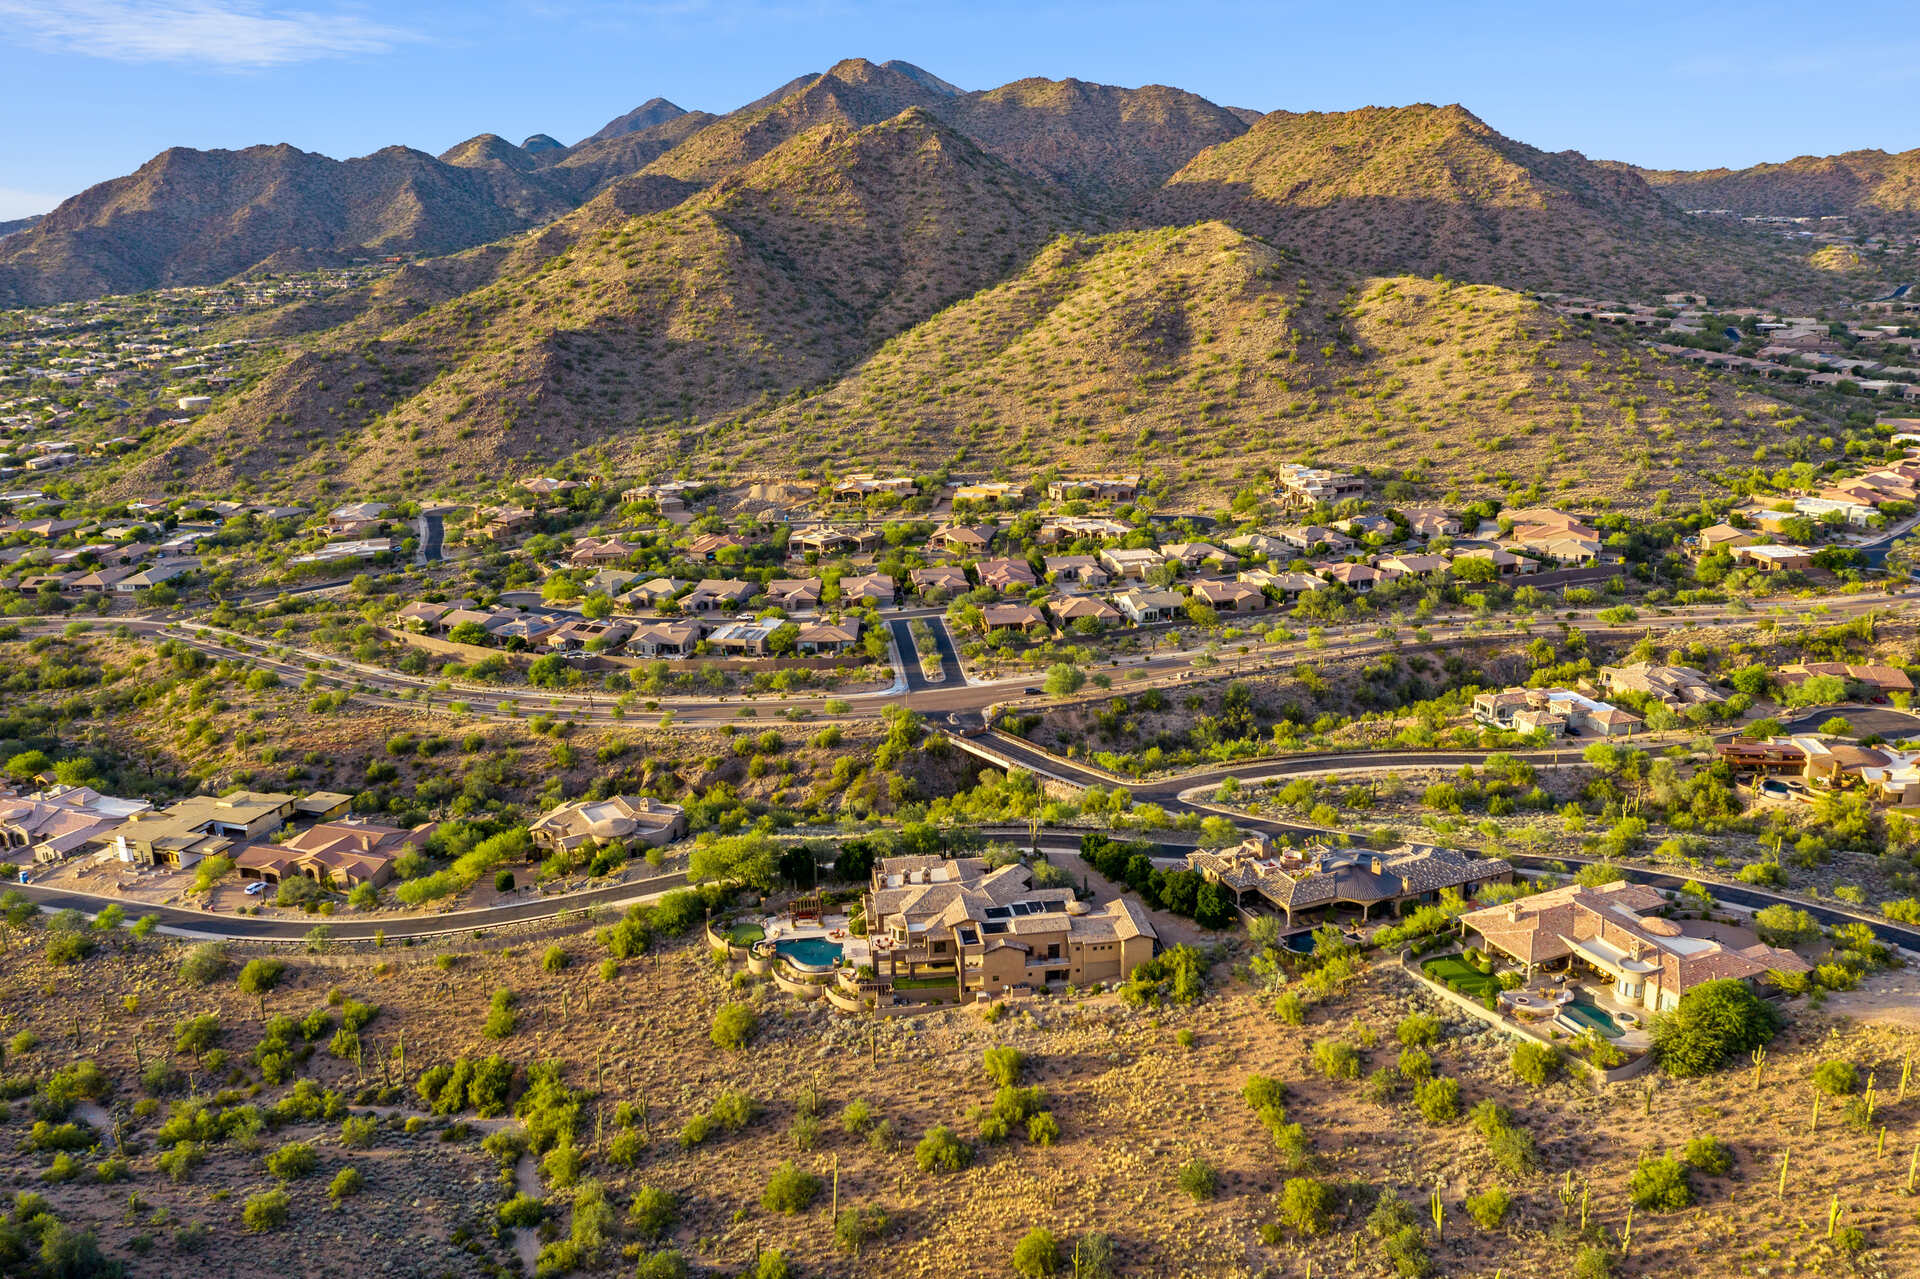
Phoenix experienced some of the most dramatic rent growth in the nation during 2021–2022, followed by a normalization period — and as of early-to-mid 2026, several Valley submarkets have actually seen rents pull back year-over-year rather than continue climbing. As an advisor, I think it's important to give clients the full picture, including the pullback, because chasing peak-cycle numbers leads to bad underwriting. Two cities are the exceptions worth noting: Scottsdale and Buckeye are still posting positive year-over-year rent growth while most of the rest of the Valley has softened.
What drives rent growth in Arizona specifically:
Sources: Zillow Rental Manager market trends (Phoenix, Scottsdale, Mesa, Tempe, Gilbert, Buckeye); Phoenix New Times analysis of Valley rent data, April 2026 (Glendale, Goodyear, Tempe, Buckeye); RentCafe/Yardi Matrix (Chandler, Peoria). Figures are a single-point-in-time snapshot and will shift — this chart should be refreshed quarterly using Zillow Observed Rent Index, Apartment List, and local MLS rental comps.
Common mistakes Arizona
investors make
After hundreds of investment property conversations — and having made some of these myself early on — here are the errors I see most often and how to avoid them.
Property management —
what Arizona investors need to know
Property management is where investment property theory meets reality. Arizona has a healthy market of professional PM companies, but quality varies significantly. One thing that surprises out-of-state investors: unlike many markets where PM fees are quoted as a percentage of rent, the Phoenix-area norm for long-term rental management is a flat monthly fee — typically $70–$120/month regardless of what the property rents for, rather than the 8–10%-of-rent model common elsewhere. On a $2,000/month rental, that's the equivalent of roughly 3.5–6% — often meaningfully cheaper than a percentage-based structure once rent climbs above the $1,200–$1,500 range. Always ask whether a quoted fee is flat or percentage-based before comparing PM companies; it materially changes your underwriting at higher rent levels. There's typically a separate leasing fee on top (commonly 50–100% of one month's rent for tenant placement). MTR and STR management fees are structured differently — usually a percentage of revenue, often 20–30% — due to the higher turnover and guest coordination involved.
Questions to ask every PM company: Is your fee flat or percentage-based, and at what rent level does that matter for me? What's their average days-to-lease? What's their current portfolio vacancy rate? Do they own investment property themselves? How do they handle HVAC emergencies in summer? Do they use in-house maintenance or outsourced vendors?
I maintain a vetted referral network of Phoenix-area property managers across LTR, MTR, and STR — happy to connect you with the right fit for your strategy.
LLC & entity structure —
what investors ask most
One of the most common questions: "Should I buy in my name or an LLC?" The right answer depends on your overall financial picture, existing assets, and tax situation — always consult a qualified Arizona real estate attorney and CPA. Here's the framework most Arizona investors use.
Common approach: Buy in personal name using conventional financing, then transfer to an LLC after closing via deed transfer (consult your lender and attorney — some loans have due-on-sale clauses). Arizona also recognizes Series LLCs, which some investors use to hold multiple properties under one umbrella entity with separate liability series per asset.
LTR, STR & MTR —
which strategy fits your goals?
There's no single "best" rental strategy in Arizona — only the strategy that best fits your property, your submarket, your time, and your tolerance for regulatory risk and revenue variance. Here's how I break it down for clients.
Long-Term Rental (LTR)
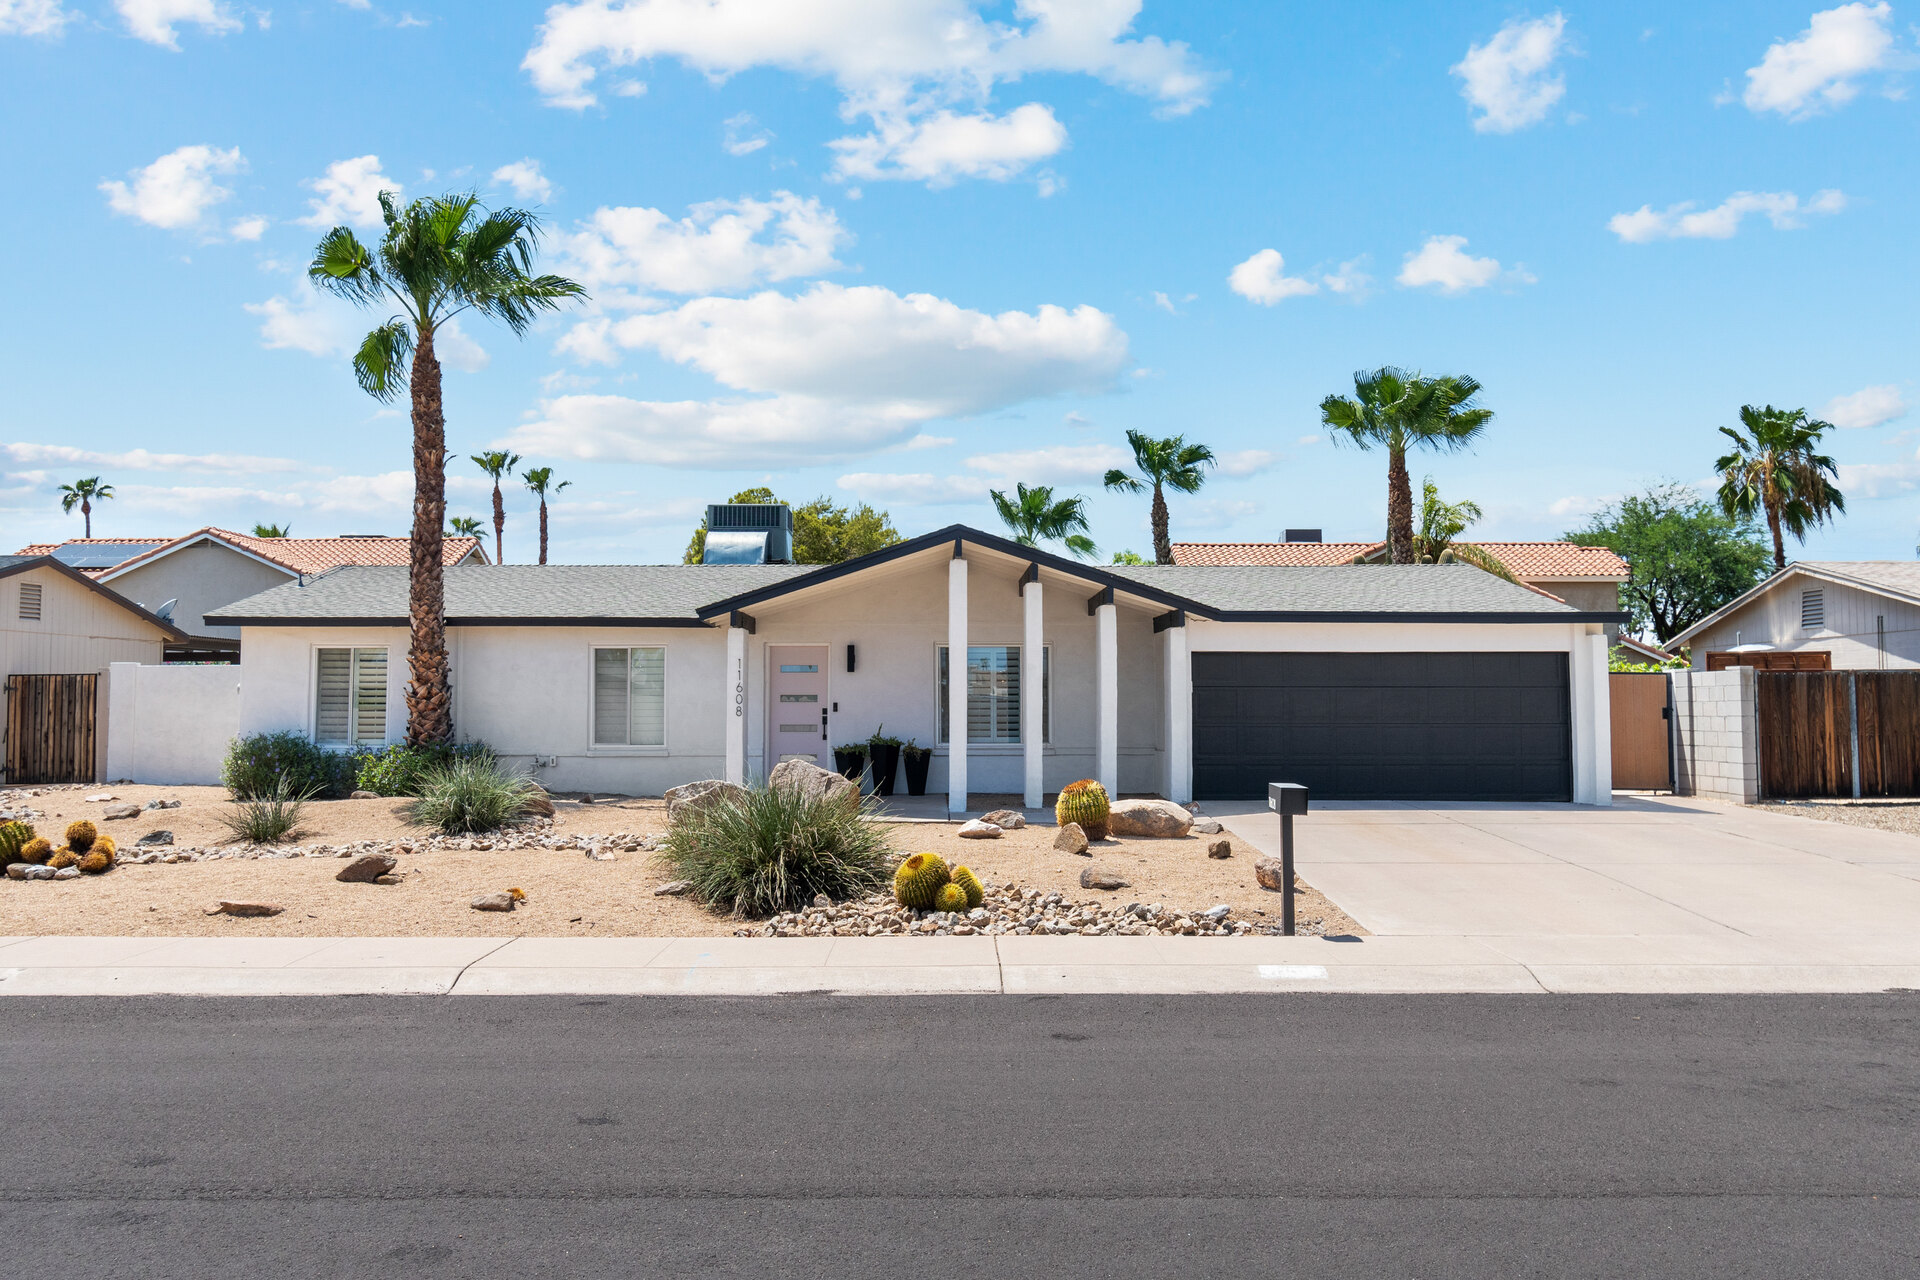
LTRs (12-month leases) are the bread-and-butter strategy for most of my investor clients, particularly those building a buy-and-hold portfolio for retirement income or wealth transfer. I look for 3 bed / 2 bath single-family homes in the 1,400–2,000 sq ft range — the "sweet spot" for tenant demand — near major employers, freeways (Loop 101, Loop 202, I-10), and good school districts.
| Line item | Monthly amount |
|---|---|
| Gross rent | $2,000 |
| Mortgage (P&I) | $1,100 |
| Property tax (1/12) | $130 |
| Insurance (1/12) | $85 |
| Property management (flat rate) | $95 |
| Maintenance reserve | $100 |
| Vacancy reserve (5%) | $100 |
| Net cash flow | ≈ $390 |
Short-Term Rental (STR)
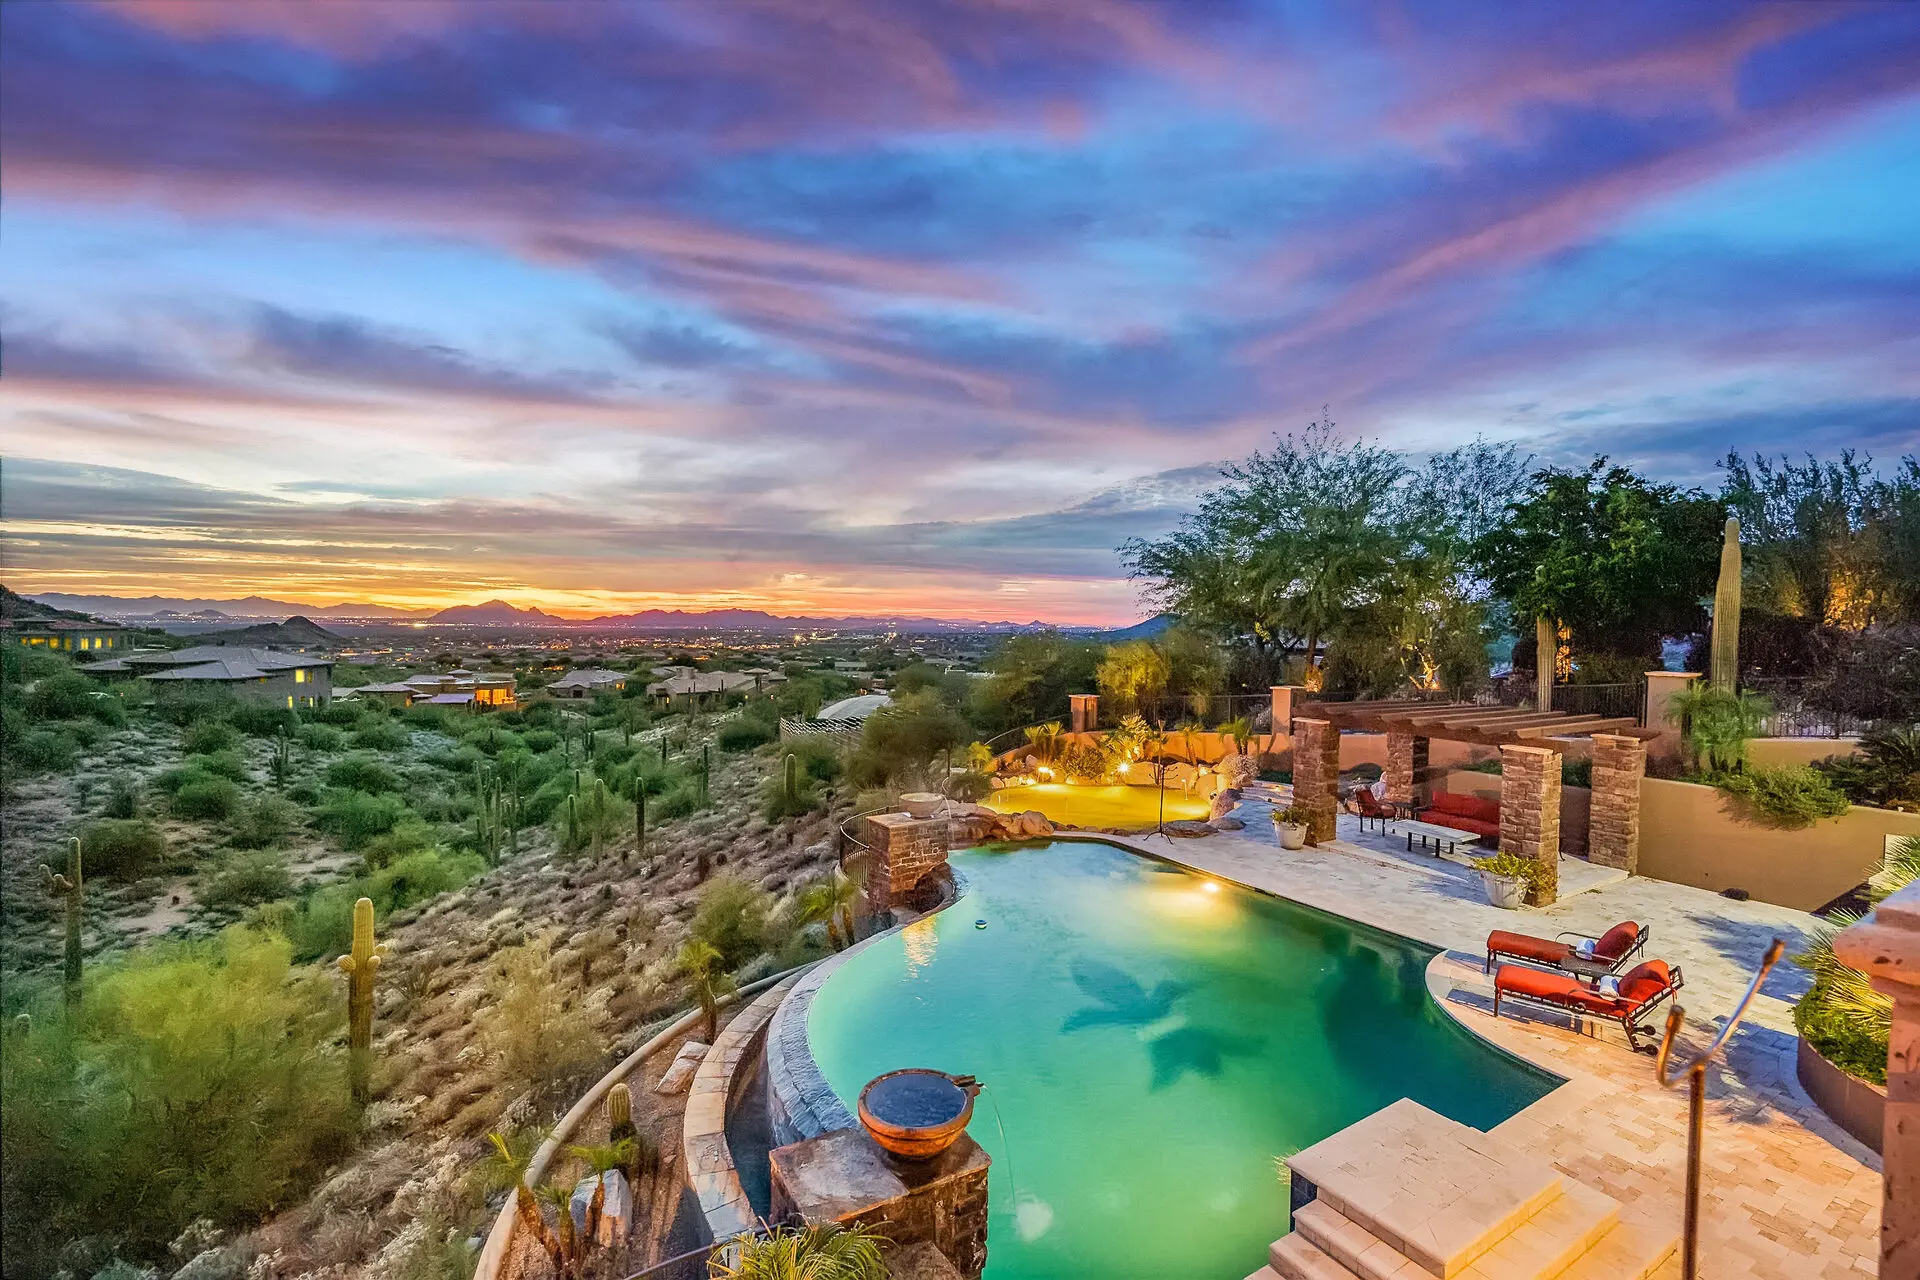
Short-term rentals are not one-size-fits-all in Arizona, and I steer a meaningful share of clients away from STR when the numbers — or the local regulatory environment — don't support it. STRs tend to perform best in Scottsdale (golf tourism, spring training, WestWorld events), North Phoenix/Carefree/Cave Creek (desert retreat aesthetic, group travel), and Sedona-adjacent areas (year-round nature tourism).
Arizona passed legislation (HB 2672 and subsequent amendments) giving cities more authority to regulate STRs, including mandatory registration/licensing, emergency contact requirements, occupancy and event restrictions, and — in cities like Scottsdale — stricter local ordinances within the bounds of state law. Always verify current city-specific ordinances before purchasing with an STR strategy in mind.
Arizona STRs are highly seasonal — peak season runs roughly October through April, with a significant summer slowdown when daily temperatures regularly exceed 105°F. Pool maintenance, HVAC reliability, and fast cleaning turnovers during peak season are operating realities unique to this market.
Illustrative demand index based on general Scottsdale/North Phoenix STR booking patterns. Actual occupancy varies by property, pricing, and platform — verify with current comp data for your specific submarket.
Mid-Term Rental (MTR)
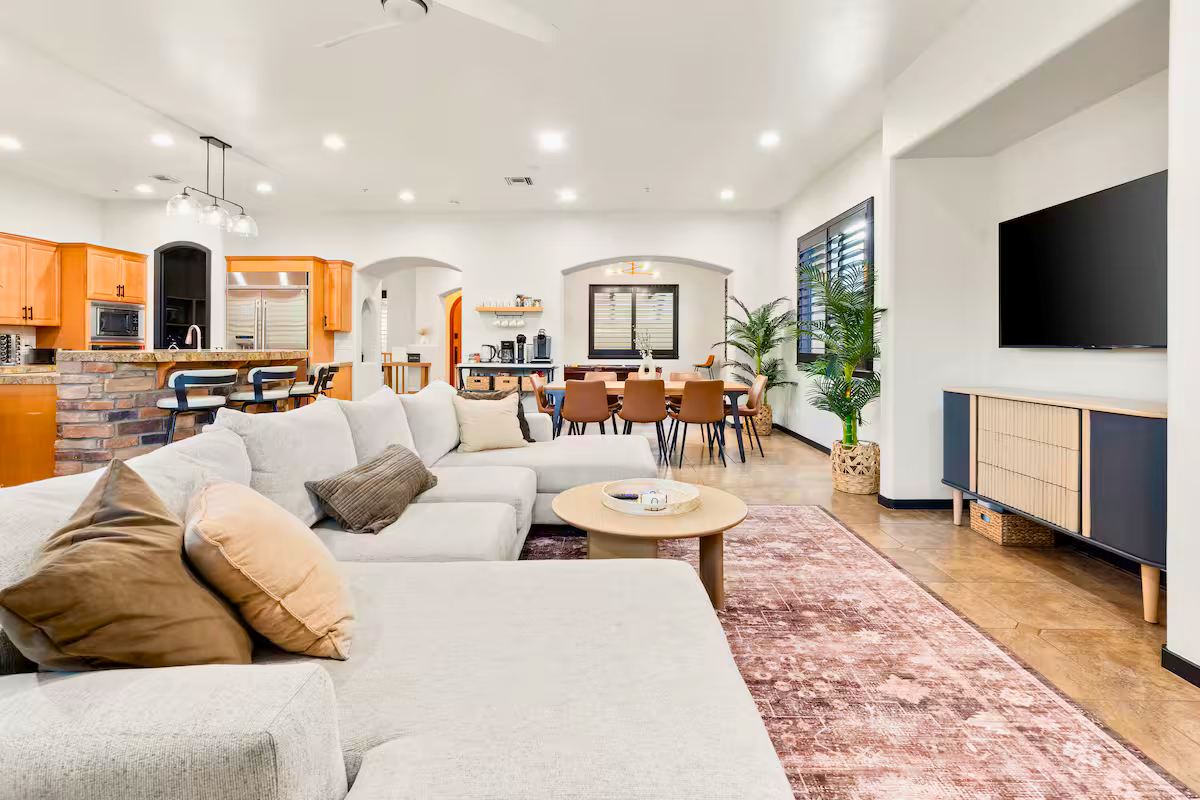
Mid-term rentals (typically 1–9 month furnished stays) occupy a sweet spot I think is genuinely underutilized — and Arizona's economy creates several distinct MTR tenant pools: traveling healthcare professionals (Banner, HonorHealth, Mayo Clinic, Dignity Health regularly bring in nurses and physicians on 13-week-plus contracts), snowbirds seeking 2–4 month stays, corporate relocations tied to semiconductor/tech/healthcare expansion, and insurance/displacement housing.
| Factor | LTR | MTR | STR |
|---|---|---|---|
| Typical lease length | 12 months | 1–9 months | 1–30 nights |
| Furnishing required | No | Yes | Yes |
| Revenue potential | Baseline | 1.3–1.8x LTR | Highest, highest variance |
| Management intensity | Low | Moderate | High |
| Regulatory risk | Low | Low–Moderate | Moderate–High |
| Best-suited markets | Most submarkets | Near hospitals/employers, snowbird zones | Scottsdale, North Phoenix, tourist corridors |
Financing options for
Arizona investment property
| Loan type | Min. down | Qualification basis | Best for |
|---|---|---|---|
| Conventional investment | 15–25% | Personal + rental income | Standard buy-and-hold |
| DSCR | Varies (often 20%+) | Property cash flow | Portfolio investors, self-employed |
| FHA (house hack) | 3.5% | Personal income | First-time, owner-occupant multi-unit |
| VA (house hack) | 0% | Personal income | Eligible veterans, owner-occupant multi-unit |
Expected returns —
cap rates, cash flow & appreciation
One thing my wealth management background trained into me: never let a client anchor to best-case scenarios. Arizona real estate has historically delivered strong total returns — cash flow, appreciation, and tax benefits combined — but the mix varies significantly by strategy and submarket.
| Strategy | Typical cap rate range | Primary return driver |
|---|---|---|
| LTR — core submarkets (Scottsdale, Central Phoenix) | 3.5–4.5% | Appreciation-weighted |
| LTR — value submarkets (West Valley, parts of East Valley) | 4.5–6% | Balanced cash flow / appreciation |
| MTR | 5–7% (effective) | Cash flow-weighted |
| STR — strong markets (Scottsdale, North Phoenix) | 6–10%+ (variable) | Cash flow, high variance |
The total return picture: a 10-year hold
Projected cumulative return on a $400K LTR property in a West Valley submarket — combining cash flow, principal paydown, and appreciation at a conservative 3–4% annual rate. Illustrative only; depreciation and other tax benefits shown separately below.
Top cities to invest
in Arizona
| City | Best strategy fit | Price tier | Growth trend | Notable driver |
|---|---|---|---|---|
| Phoenix (Core) | LTR, MTR | Mid–High | Steady | Diverse employment, urban infill |
| Scottsdale | STR, LTR | High | Moderate | Tourism, golf, healthcare |
| Chandler | LTR, MTR | Mid–High | Strong | Tech / semiconductor employment |
| Mesa | LTR | Mid | Strong | Affordability, light rail expansion |
| Gilbert | LTR | Mid–High | Strong | Family demand, schools |
| Tempe | LTR, MTR | Mid–High | Steady | ASU, urban rental demand |
| Glendale | LTR | Mid | Moderate | Sports / entertainment district |
| Peoria | LTR, MTR | Mid | Strong | Spring training, new development |
| Goodyear | LTR, Build-to-Rent | Mid | Strong | West Valley growth corridor |
| Buckeye | LTR, Build-to-Rent | Lower–Mid | Fastest in Valley | New construction, affordability |
| Litchfield Park | LTR | Mid–High | Steady | Established community, strong schools |
| Queen Creek | LTR, Build-to-Rent | Mid–High | Among fastest in state | Master-planned growth, Pinal corridor |
Phoenix (Core/Urban): Diversified tenant pools and proximity to downtown employment growth. Older housing stock means more value-add opportunity — and more maintenance.
Scottsdale: The premier STR market in the state, but also one of the most regulated and expensive — best for investors with higher capital and active management.
Chandler: My pick for MTR investors given the concentration of tech employment generating consistent corporate and contractor housing demand.
Peoria: Spring training brings seasonal STR/MTR opportunity around Peoria Sports Complex, while broader growth supports solid LTR fundamentals.
Goodyear & Buckeye: The two fastest-growing West Valley cities, with significant new construction — including build-to-rent communities — for investors prioritizing newer properties and appreciation potential.
Litchfield Park: A smaller, more established West Valley community next door to Goodyear — strong schools and a tighter-knit feel attract longer-tenured LTR tenants, with less new-construction competition than its faster-growing neighbors.
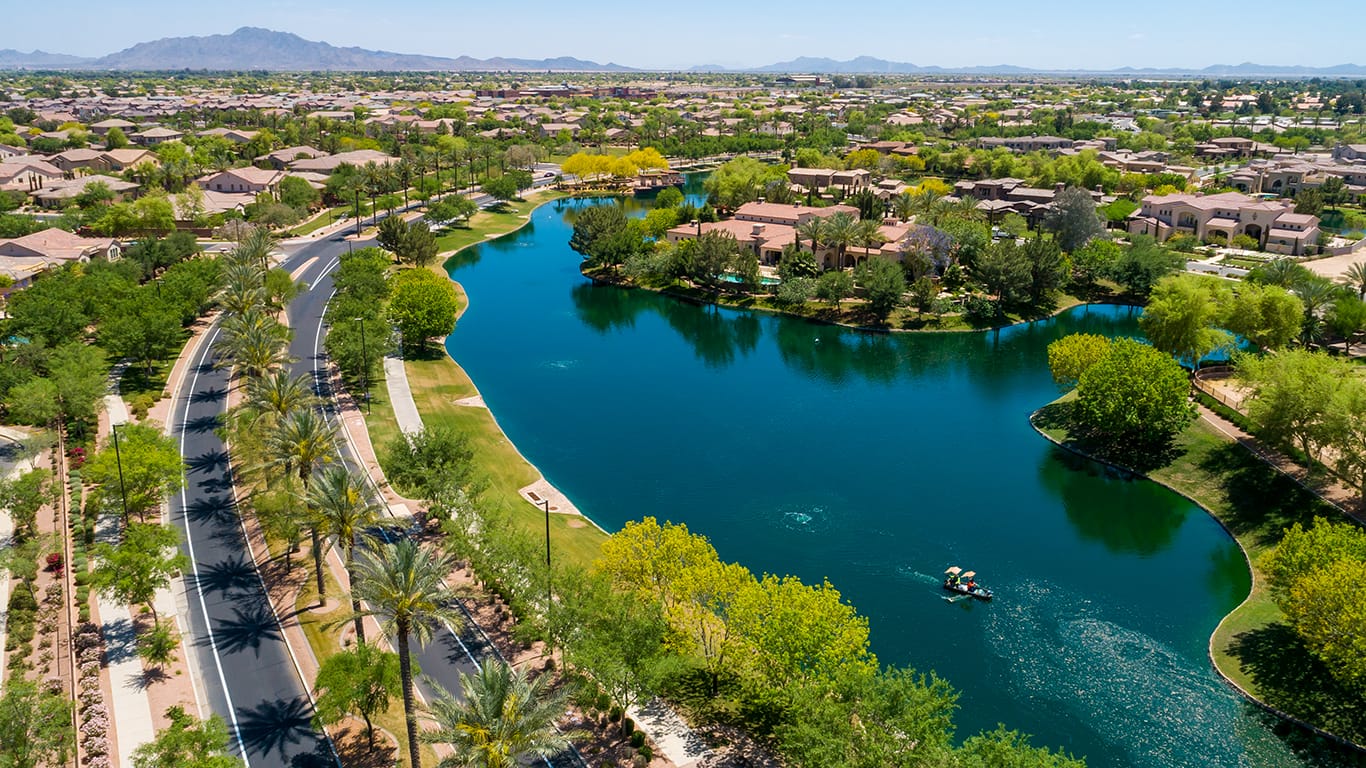
Queen Creek: Sitting partly in Pinal County, Queen Creek has been one of the fastest-growing communities in the entire state by percentage — master-planned development and proximity to the Loop 202 extension make it a strong LTR and build-to-rent candidate for investors comfortable with a slightly longer commute to core Phoenix employment.

Client case studies —
how investors actually win here
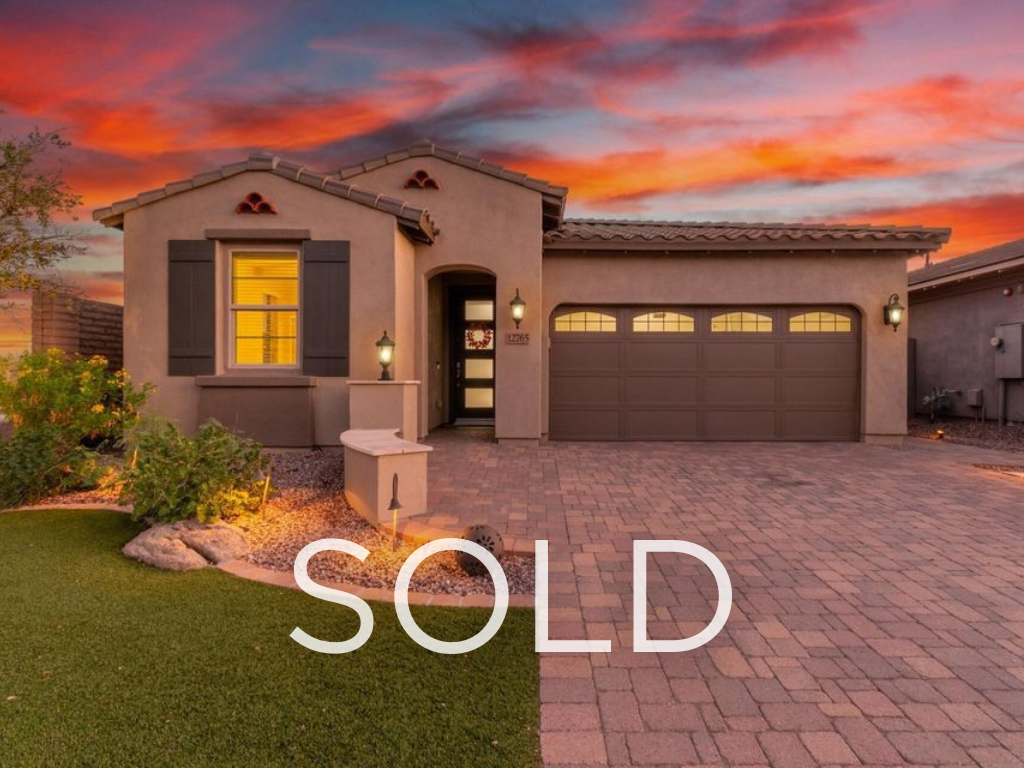
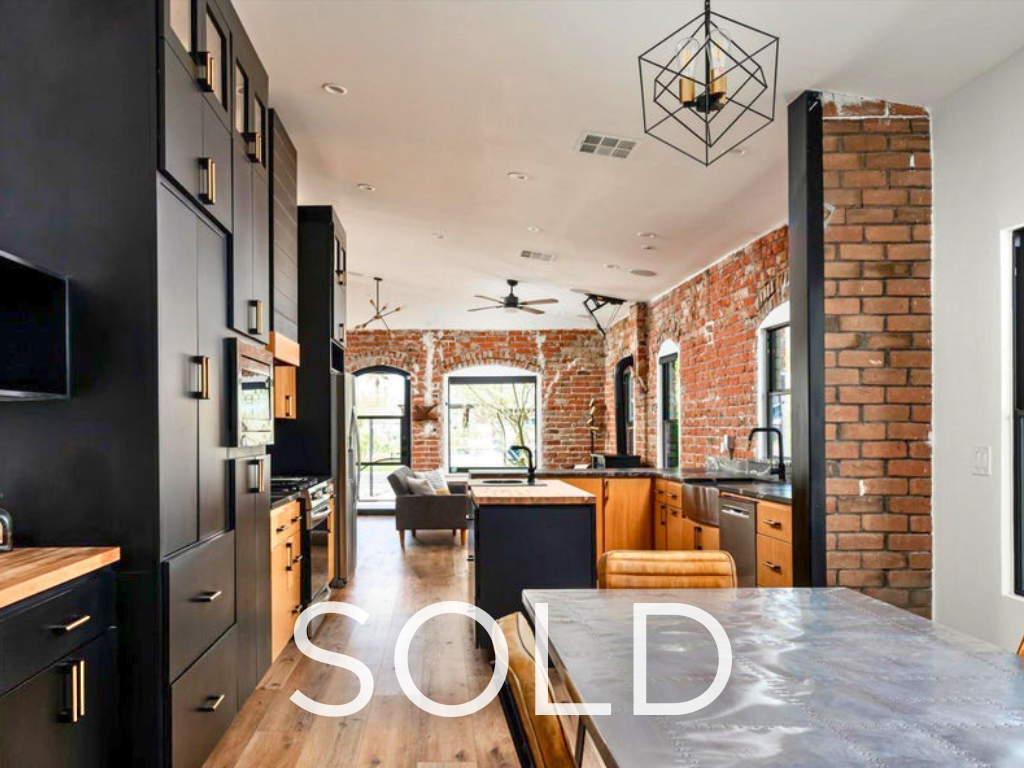
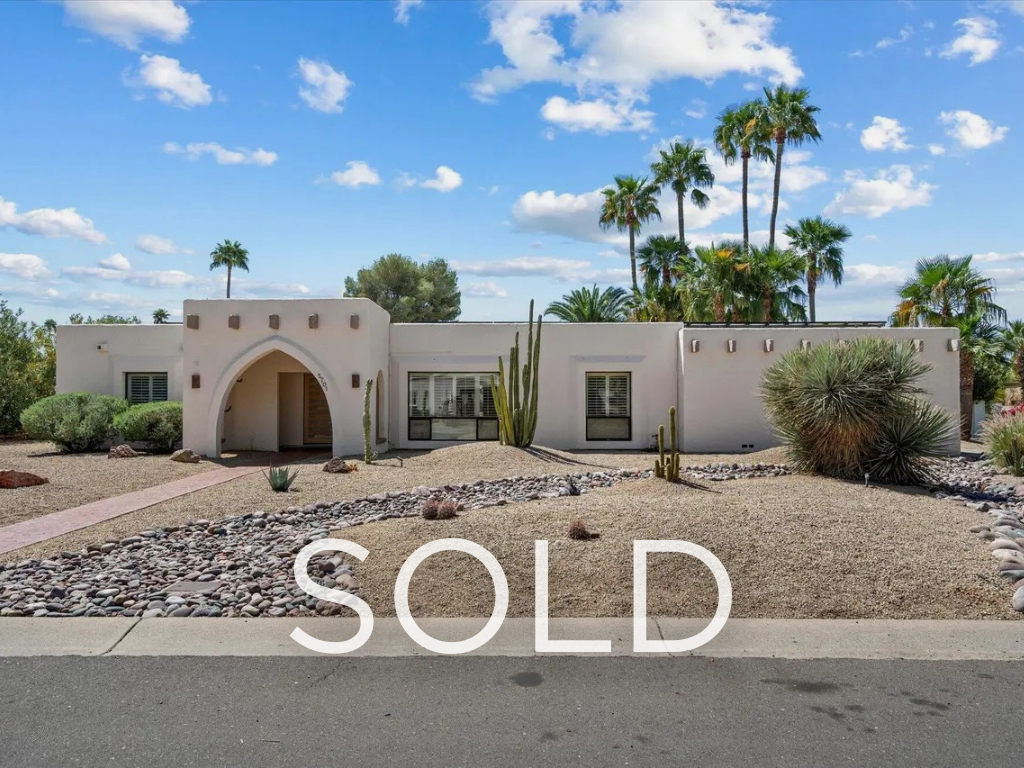
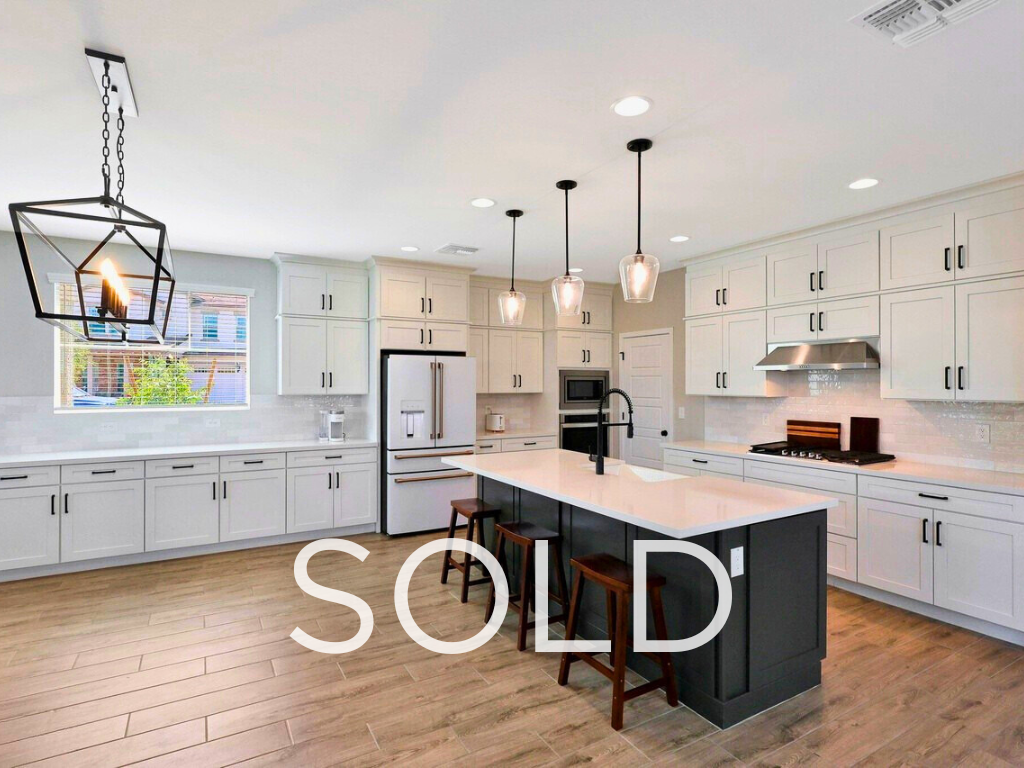
These are real client transactions — real numbers, real strategies, real outcomes. Each links to a full case study on the blog with complete detail on negotiation, financing, tax structure, and results.
Frequently asked
questions
150+ five-star reviews —
a few, in their own words
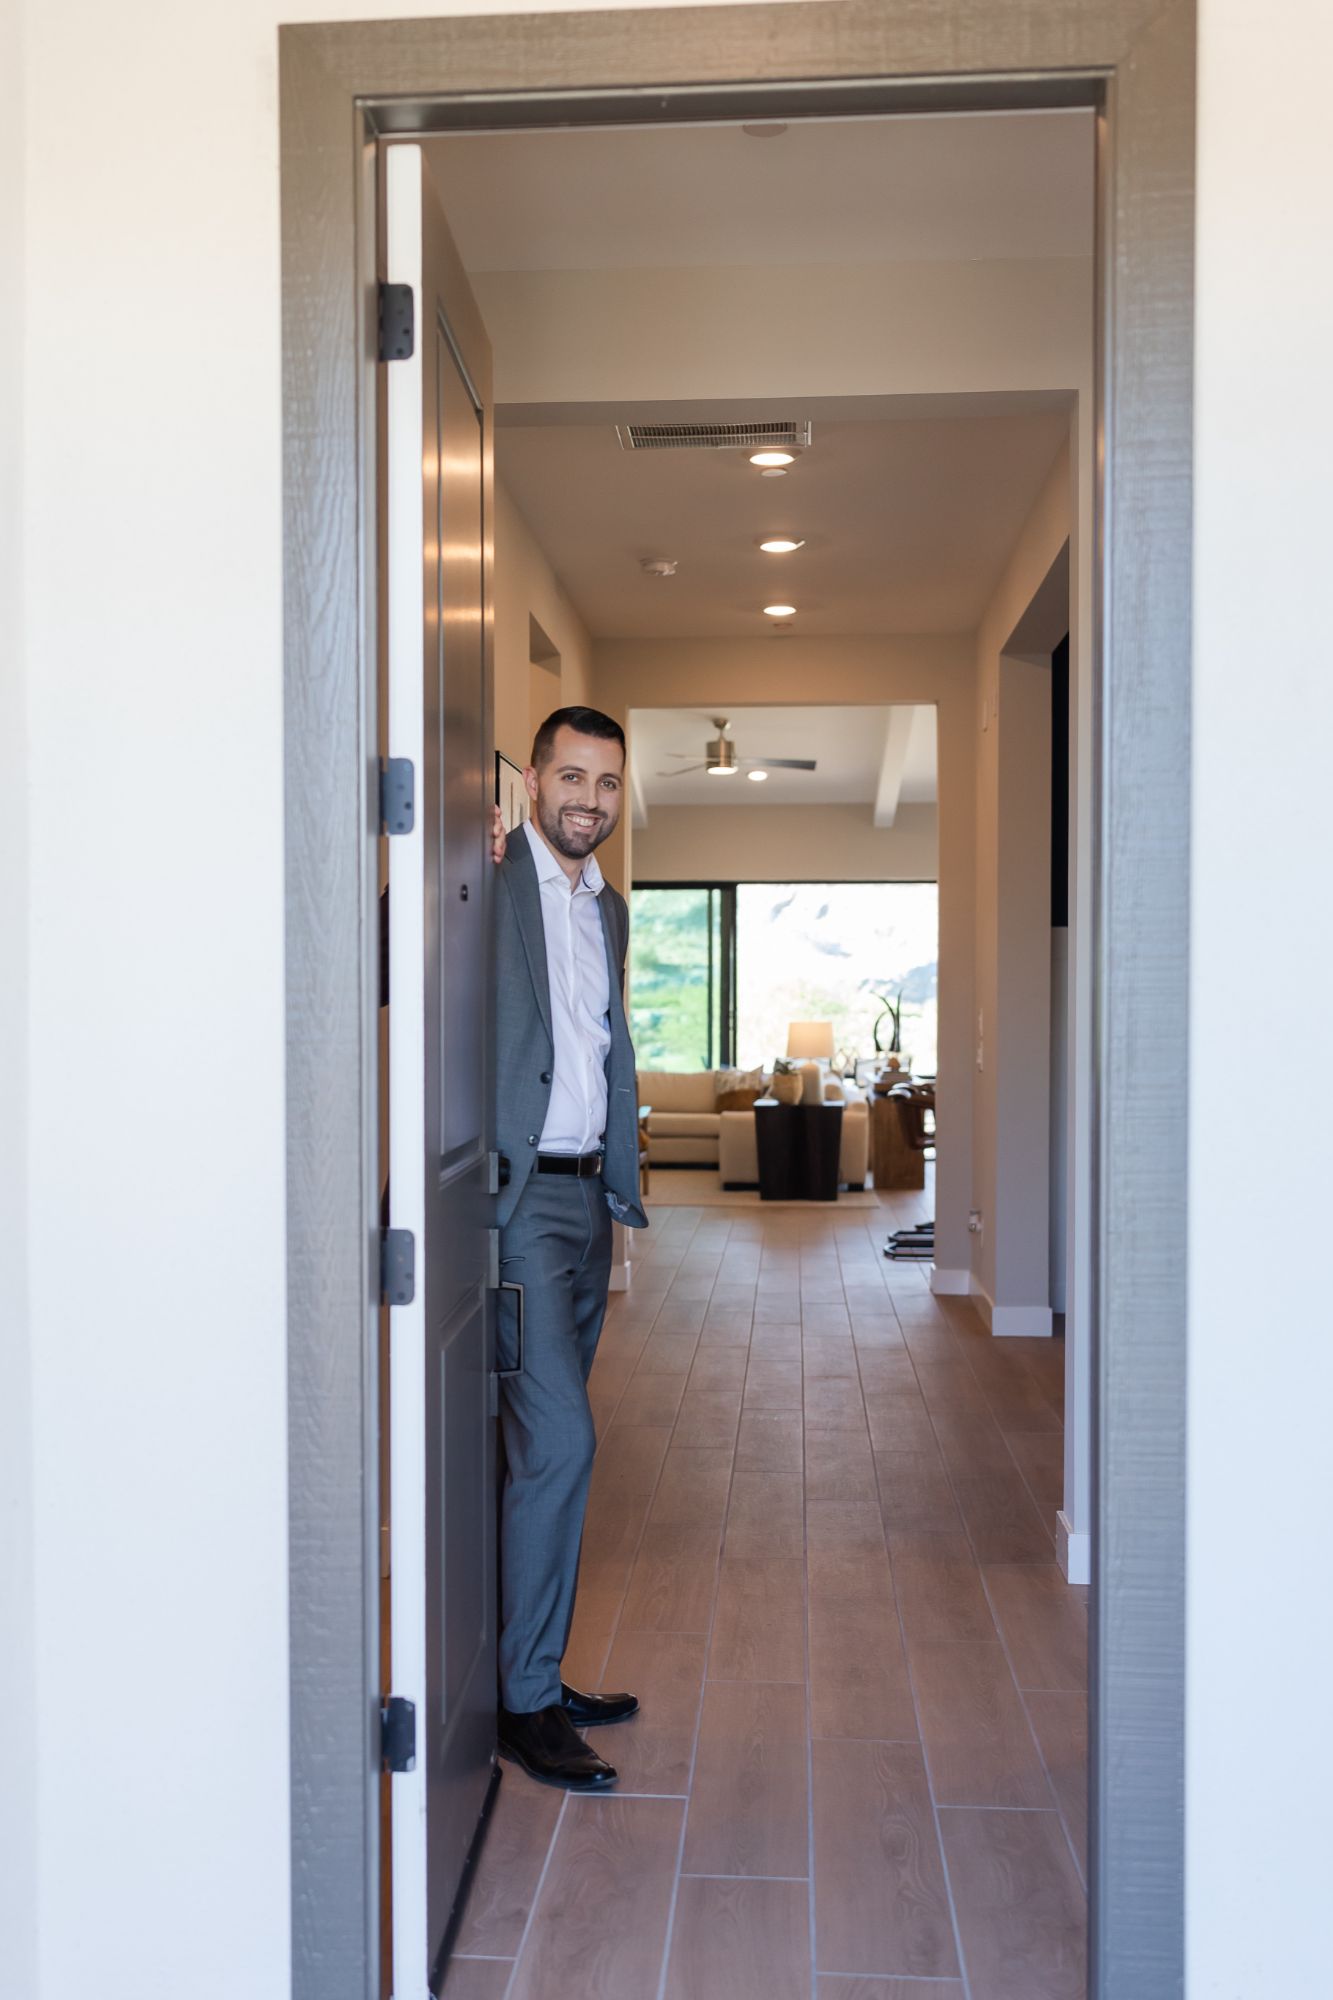
Eric has closed more than $100M in residential sales and helped clients build over $133M in long-term wealth across the Greater Phoenix Metro — backed by 150+ five-star Google reviews. Here's what investors specifically have said.
The background that makes
this advice different
Most real estate agents can tell you what a property sold for. Eric can tell you what it's worth as an asset — because he spent years doing exactly that before he ever held a real estate license. His career began in wealth management, eventually serving as a Director of Wealth Management, working alongside advisors managing high-net-worth client portfolios across equities, fixed income, and alternative investments. Real estate came up in nearly every serious portfolio conversation — and almost every client had more questions about it than their advisor could answer. Eric eventually decided to become the person who could.
He earned his REALTOR® designation and went on to add a stack of credentials most agents never pursue: CRS (Certified Residential Specialist — held by fewer than 3% of agents nationwide), GRI, ABR, MRP, SRES®, and RSPS. Today he's recognized as a Top 1% REALTOR® across North America and ranks among the Top 100 agents in Greater Phoenix, with more than $100M in closed residential sales and 150+ five-star Google reviews. He built a practice that reflects the way he was trained to think: lead with data, model the downside, be honest about the variance, and never let a client anchor to a best-case number.
What makes Eric genuinely unusual in the investor-agent space isn't just the credentials. It's that he has done personally what he advises clients to do. He owns rental property in Arizona, has executed a 1031 exchange to reposition appreciated assets into higher-yielding holdings, and has lived the relocation experience six times over — three different states, six moves across the Valley. He knows what it feels like to pick a neighborhood without perfect information, to set up a household in a new city, and to figure out whether to rent first or buy immediately. That lived experience shapes every client conversation.

WSJ · MarketWatch
MSN · Morningstar
Neighborhood-level data —
zip codes that outperform
City-level data is where most investor guides stop. But the difference between the right zip code and the wrong one in Phoenix is often the difference between a cash-flowing property and a vacant one. Here's how I break it down for my top three strategy-specific markets.
Chandler — Best Zip Codes for MTR
Chandler's MTR demand is driven by Intel's Ocotillo campus, Chandler Regional Medical Center, and the Price Road Corridor tech cluster. Properties within 10–15 minutes of these anchors command premium furnished rents from contractor and healthcare travelers on 30–90 day stays.
| Area / Zip | Primary Driver | MTR Tenant Profile | Notes |
|---|---|---|---|
| Ocotillo / 85249 | Intel campus, tech contractors | Engineers, tech workers, 30–90 day stays | Newer stock, higher rents; watch HOA STR restrictions |
| Downtown Chandler / 85225 | Urban walkability, restaurants | Young professionals, corporate relocation | Older housing stock; more value-add resale opportunities |
| Near Chandler Regional / 85224 | Healthcare employment corridor | Traveling nurses, locum tenens physicians | Strong year-round occupancy from 13-week contracts |
| Price / Dobson corridor / 85248 | Mixed tech + medical employment | Corporate + healthcare hybrid demand | Good balance of supply and demand; solid LTR fallback |
Scottsdale — Best Zip Codes for STR
Not all of Scottsdale performs equally for STR. North Scottsdale commands the highest nightly rates but also the highest acquisition costs. Old Town and South Scottsdale offer lower entry prices with strong year-round demand — the question is whether your nightly rate justifies the competition from hotel supply in those corridors.
| Area / Zip | STR Demand Driver | Avg. Nightly Rate Tier | Notes |
|---|---|---|---|
| North Scottsdale / 85255, 85266 | Golf, luxury resorts, corporate retreats | High ($250–$600+/night) | Highest acquisition cost; strongest peak-season ADR; lower summer occupancy |
| Old Town / 85251 | Walkability, nightlife, spring training proximity | Mid ($150–$300/night) | High year-round demand; more competition from hotel supply |
| McCormick Ranch / 85258 | Golf, family-friendly, WestWorld proximity | Mid–High ($180–$350/night) | Strong event-driven demand; verify HOA STR rules |
| South Scottsdale / 85257 | Value entry, proximity to Old Town amenities | Mid ($130–$250/night) | Lower entry price; good value play; some industrial adjacency |
West Valley (Goodyear / Buckeye) — Best Zip Codes for LTR
The West Valley is a tale of two submarkets: established communities closer to I-10 (shorter commutes, stronger current rents) vs. the outer growth edge (lower acquisition cost, higher appreciation potential, more new-supply competition). For LTR investors, proximity to Loop 303 and the Goodyear/Avondale employment corridor is the key differentiator.
| Area / Zip | Primary LTR Driver | Entry Price Tier | Notes |
|---|---|---|---|
| Palm Valley / Goodyear 85338 | Established master-plan, Loop 303 access | Mid ($380K–$480K) | Strong schools, HOA-maintained, lower vacancy; proven rental demand |
| Litchfield Park / 85340 | Established community, top schools | Mid–High ($420K–$550K) | Longer-tenured tenants; lower turnover; limited new inventory |
| Goodyear (outer) / 85395 | New construction, spring training proximity | Mid ($360K–$450K) | More new-supply competition; longer lease-up on new builds |
| Buckeye / 85326, 85396 | Affordability, growth, new construction | Lower–Mid ($320K–$420K) | Highest appreciation potential; some rent softness from new supply absorption |
Arizona landlord-tenant law —
the quick-reference investors need
Arizona is governed by the Arizona Residential Landlord and Tenant Act (ARLTA), ARS Title 33, Chapter 10. It applies to nearly all residential rental properties in the state. Here's the investor-relevant framework — the rules that affect your cash flow, your liability, and your timeline when things go sideways. This is not legal advice; consult a qualified Arizona real estate attorney for your specific situation.
| Topic | Arizona Rule | Investor Impact |
|---|---|---|
| Security deposit max | 1.5× monthly rent (hard cap statewide) | On a $2,000/month rental: max $3,000 deposit. Collect less and you have limited protection; collect more and the cap is violated. |
| Deposit return deadline | 14 business days after move-out + key return + forwarding address; itemized list of deductions required | Miss this window and tenants can sue for 3× the amount wrongfully withheld (ARS §33-1321). Use a PM or calendar reminder. |
| Allowable deductions | Unpaid rent, utilities, late fees, damage beyond normal wear and tear, lease violation costs | Document move-in condition with photos and a signed checklist — required by law and your best defense in disputes. |
| Non-payment eviction notice | 5-day written notice to pay or quit (ARS §33-1368) | One of the fastest eviction timelines in the country — a major landlord-friendly advantage over CA, NY, IL. |
| Lease violation eviction notice | 10-day notice to cure or quit for curable violations; 10-day immediate quit for uncurable (criminal activity) | Keep all notices in writing; certified mail or hand-delivery is recommended for documentation. |
| Eviction to possession timeline | Typically 5–15 business days from filing (if uncontested) in Maricopa County Justice Court | Total eviction timeline from notice to possession can be as short as 3–4 weeks in Arizona — vs. 3–6+ months in California. |
| Self-help evictions | Strictly illegal — no lock changes, utility shutoffs, removal of belongings | Never. Doing so creates significant liability even when the tenant is clearly in violation. |
| Landlord entry notice | Minimum 48 hours' written or verbal notice; entry only at reasonable times (8am–8pm unless tenant agrees otherwise) | Violations allow tenants to terminate lease and/or claim damages. Put all entry notices in writing. |
| Rent increases | No rent control; increases allowed at any time with 30 days' written notice for month-to-month tenancies; fixed-term leases locked until renewal | No state or city rent control law — and state law preempts cities from creating one. |
| Repairs — landlord timeline | 5 days for health/safety issues; 10 days for other habitability issues, after written tenant notice | Failure to repair within these windows gives tenants repair-and-deduct rights or lease termination grounds. |
| Pool enclosure disclosure | Required disclosure for any rental with pool access | Relevant for STR and higher-end LTR properties — document and disclose. |
| Required move-in disclosures | Signed lease copy; blank condition checklist; pool disclosure if applicable; utility billing methods; landlord/PM identity | Missing disclosures are a common source of legal exposure — use a professional lease and PM checklist. |
Source: Arizona Residential Landlord and Tenant Act (ARLTA), ARS Title 33 Chapter 10. Maricopa County Justice Court procedures. Not legal advice — consult a licensed Arizona real estate attorney before acting on any of the above.
New construction vs. resale —
what Arizona investors need to compare
Every investor engagement I do includes a side-by-side comparison of new construction and resale before any commitment is made. In 2026, the answer is less obvious than it was in 2022 — resale homes have regained competitiveness as builder incentives have pulled back and seller concessions have increased. But new construction still offers genuine structural advantages for buy-and-hold investors with longer time horizons. Here's how I frame the comparison.
| Factor | New Construction | Resale | Investor Verdict |
|---|---|---|---|
| Purchase price | Premium over resale in same submarket; lot premiums add $10K–$40K+ | More room to negotiate; price reductions common; seller concessions at ~50–56% of closings in 2025 | Resale often better on entry price right now |
| Financing / rate | Builder buydowns (4.5%–5.5% range in Q2 2026 — vs. earlier 3.99% peak); closing cost credits | No built-in rate advantage; negotiate seller credit toward buydown | New construction had an edge; gap has narrowed significantly in 2026 |
| Warranty | 1-yr workmanship, 2-yr mechanical, 10-yr structural (standard builder warranty) | No structural warranty; inspection contingency is your protection | New construction wins — significant out-of-state investor advantage |
| Maintenance costs | Minimal for years 1–7; newer HVAC, roof, plumbing, electrical | Higher near-term risk especially on pre-2000 stock (older roof, plumbing, HVAC) | New construction wins for predictable underwriting |
| Energy efficiency | Modern building codes: better insulation, energy-efficient HVAC, often solar-ready — lower tenant utility bills | Older builds can have high utility costs; matters to tenants | New construction wins — especially relevant for LTR tenant quality |
| Landscaping / move-in ready | Often minimal/no landscaping included; add $5K–$20K+ post-close | Established landscaping, mature trees, move-in ready | Resale wins — lower total initial outlay for rental-ready condition |
| Location | Concentrated on outer ring (Buckeye, Queen Creek, Maricopa, San Tan Valley) — further from core employment | Available throughout Valley including core submarkets with higher employment density | Resale wins for MTR / proximity-dependent strategies |
| HOA | Almost always HOA; newer communities often $80–$200/month; CC&Rs may restrict STR | Varies; many older core-city properties have no HOA | Resale wins for STR strategy; new construction HOAs often restrict short-term rental use |
| Appreciation potential | Higher in growth corridors (Buckeye, Queen Creek); supported by surrounding new infrastructure | Stronger in supply-constrained core submarkets (Scottsdale, central Phoenix, Tempe) | Depends on submarket — outer growth = new construction; core = resale |
| Timeline | 6–12 month delivery for spec/semi-custom; quick move-in inventory available | 30–45 day close standard; faster to cash-flowing | Resale wins if time-to-rent matters |
Arizona rental property insurance —
what's different here
Insurance is the most consistently underestimated line item in Phoenix investor underwriting — partly because Arizona-specific risks look different from what most out-of-state buyers expect. No frozen pipes, no hurricane season. But monsoon hail, haboob wind damage, pool liability, and the unique underwriting restrictions that come with older Arizona housing stock create a coverage landscape that surprises investors who quote a generic national rate and move on.
The first thing to know: your homeowner's policy is void the moment you rent to tenants. Most carriers will deny claims entirely on tenant-occupied properties covered only by an HO-3 policy. You need a DP-3 dwelling fire policy (landlord policy) — and the specifics matter considerably in Arizona.
| Issue | Arizona-Specific Detail | What to do |
|---|---|---|
| Policy type | HO-3 (homeowner) voids coverage the moment tenants move in — most carriers will deny claims entirely | Switch to a DP-3 landlord/dwelling fire policy before tenant occupancy — no exceptions |
| Roof age | Carriers routinely restrict or refuse coverage on tile roofs 20+ years old; ACV (actual cash value) rather than replacement cost is common — meaning you pay the depreciation gap on a claim | Verify roof age before purchasing any resale property; factor potential replacement cost into your offer |
| Polybutylene ("Big Blue") plumbing | Common in Phoenix/Tucson homes built 1978–1995; prone to rupture in desert heat; most 2026 carriers deny coverage or exclude water damage on these pipes entirely | Request plumbing disclosure on any pre-2000 property; factor PEX/copper replacement cost (~$8K–$15K) into purchase math |
| Pool liability | Arizona has one of the highest pool densities in the country; standard general liability may not cover drowning/injury without specific endorsement; STR pool liability requires separate coverage | Ensure pool liability is explicitly covered; consider $1M+ umbrella for properties with pool access; STR investors need a short-term rental-specific policy |
| Monsoon / haboob damage | Monsoon season (June–September) brings wind, hail, dust storms; roof and window damage is common; standard DP-3 covers wind/hail but flood (rising water) requires a separate NFIP policy | Confirm wind/hail is covered; add flood coverage in any low-lying or near-wash location; loss of rental income endorsement is critical if property becomes uninhabitable |
| HVAC breakdown | AC failure in July = guest/tenant emergency; not covered by standard property coverage; "equipment breakdown" endorsement adds this | Add an equipment breakdown endorsement (~$50–$100/yr); also keep a 24-hr HVAC service contact in your PM agreement |
| Vacancy / seasonal rental | Standard DP-3 policies void coverage after 30 consecutive vacant days; STR properties that go unoccupied in summer are at risk | Confirm your policy has a vacancy permit or is explicitly rated for seasonal/short-term rental use |
| STR policy requirement | Standard landlord DP-3 does not cover short-term rental guests; requires a specific STR endorsement or separate policy (Proper, Slice, Steadily, etc.) | Never list on Airbnb/VRBO without a policy that specifically covers STR liability; confirm in writing with your carrier before your first booking |
| Typical DP-3 cost range | Arizona DP-3 premiums typically run 15–25% higher than a comparable owner-occupied HO-3; rough range $1,200–$2,400/yr for a standard SFR depending on age, pool, and location | Get 3+ quotes; carriers vary significantly in Arizona; shop specialty landlord insurers (Steadily, Obie, USAA for veterans) alongside nationals |
- Dwelling coverage at full replacement cost (not ACV)
- Loss of rental income (12-month minimum)
- Liability — $300K minimum; $1M+ for pools
- Equipment breakdown endorsement
- Vacancy permit or seasonal rental rating
- Wind/hail coverage (monsoon season protection)
- Tenant damage/vandalism coverage
- ✗ Using an HO-3 homeowner policy on a rental property
- ✗ Buying a pre-2000 home without checking plumbing type
- ✗ Insuring at market value instead of replacement cost
- ✗ Listing on Airbnb without an STR-specific policy
- ✗ Skipping loss of rental income coverage
- ✗ Assuming pool liability is in your standard policy
- ✗ Leaving property vacant 30+ days without a vacancy permit
Sources: Obie Insurance Arizona Landlord Guide 2026; Insurely Arizona Landlord Insurance 2026; Steadily Arizona rental insurance data. Not insurance advice — consult a licensed Arizona insurance agent for your specific property and coverage needs.
Is it a good deal? —
Eric's 12-point Arizona investor checklist
Every deal I analyze for an investor client goes through the same framework. Not every property needs to pass every point — but the ones that fail more than 3 or 4 of these usually have a reason, and it's worth understanding why before you commit capital.
More Arizona investment
guides — coming soon
I'm building out dedicated, deep-dive guides for each of the topics below. Until they're live, click any card to schedule a call and I'll walk you through it directly — often faster than reading a guide anyway.
Ready to run the
numbers on your deal?
Whether you're relocating, investing from out of state, house hacking your first property, or building a multi-property portfolio — Eric will give you an honest, numbers-first conversation. No pitch, just the real picture.
Schedule a free strategy call →