
Phoenix Housing Market Update March 2026: The Shift Is Here
Greater Phoenix Real Estate | March 2026
Phoenix Housing Market Update — March 2026:
The Shift Is Here
Contracts up 10% year over year. Inventory growth stalled. Secondary markets reversing faster than primary ones. Here is everything you need to know about the Greater Phoenix housing market right now.
In This Report
Overview
Where the Greater Phoenix Housing Market Stands Right Now
March has a way of clarifying things — and I am seeing it firsthand. The volume of people reaching out to me right now, both buyers ready to move and sellers who have been waiting for the right moment to list, is approaching levels I have not seen since 2020 and 2021. The data below explains why.
What felt like a buyer's market across much of the Greater Phoenix Valley is starting to feel meaningfully different on the ground. Several market indicators that were trending in buyers' favor just weeks ago have begun reversing course — not dramatically, not everywhere at once, but consistently enough across enough data points that it would be a mistake to ignore.
Listings under contract are running approximately 10% ahead of this same period last year and are outperforming both 2023 and 2024 at this point in the calendar. That matters because contract volume today is a reliable preview of closed sales four to six weeks out. What I am seeing in March should show up clearly in April and May closing numbers.
At the same time, new listings have pulled back. After January tracked closely with last year's pace, both February and early March have come in roughly 7% below prior year levels. Fewer homes entering the market while more homes go under contract means overall inventory — which sat about 9% above last year just last month — has already compressed to roughly 5% above last year, and that gap continues to narrow every week.
Buyers still have more choices than they did during the peak years of 2021 and 2022. But the cushion is shrinking, and it is shrinking with some speed. The coming weeks will reveal whether this momentum holds or moderates — but the directional signal right now is clear.
"The volume of people reaching out — both buyers ready to move and sellers who have been waiting — is approaching levels I have not seen since 2020 and 2021."
This shift is showing up across every major indicator simultaneously, which is what separates a genuine momentum change from a one-week statistical anomaly. The number of cities moving in favor of sellers now significantly outnumbers those moving toward buyers — the reverse of where things stood just a month ago. The average market index reading across the Valley is up meaningfully over the past four weeks after trending slightly lower for much of early 2026.
Demand remains below what would be considered a historically normal level — but the gap has recovered meaningfully. Measured against last August when demand registered roughly 24% below normal, the market is now sitting approximately 13% below normal — a nearly 50% recovery in that underlying metric over seven months. The recovery has not been a straight line. But the direction has not changed.
Supply & Demand
The Market Index: Where Supply, Demand, and Momentum Converge
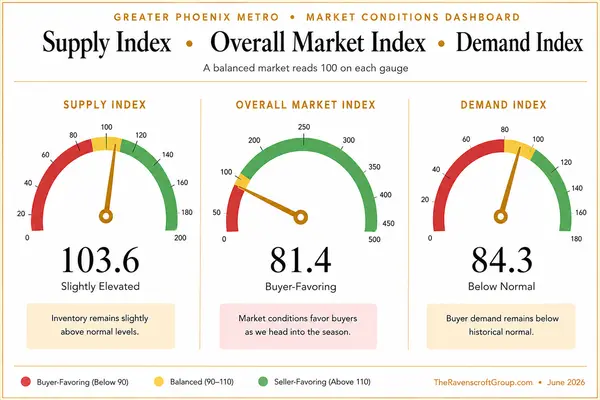
Greater Phoenix Market Conditions
Supply Index, Overall Market Index & Demand Index — March 26, 2026
Supply Index
Overall Market Index
Demand Index
A balanced market index reads near 100. Values below 100 favor buyers; values above 100 favor sellers. Data as of March 26, 2026.
The three gauges above tell a layered story. The overall market index of 82.9 places Greater Phoenix in buyer-leaning territory — but that single number conceals important nuance about direction and momentum.
Supply at 105.4 is slightly elevated relative to historical norms, but the trajectory matters more than the absolute reading. Active listing counts are no longer rising. The combination of reduced new listings and accelerating contract activity has effectively capped supply growth heading into what is historically the most active selling season of the year.
The demand index at 87.3 reflects a market that is still healing from the demand destruction caused by rapid rate increases in 2022 and 2023 — but healing it is. The improvement from 24% below normal in August to approximately 13% below normal today represents meaningful progress across seven months, and the trajectory has not reversed despite the recent uptick in mortgage rates.
When supply stops growing and demand continues recovering simultaneously, markets tend to firm. That is the dynamic currently in play across Greater Phoenix — and it is beginning to show up in contract velocity, days on market, and list-to-sale price ratios in the most competitive corridors.
Historically, this is the inflection point that precedes a shift in pricing trends. Markets do not reprice overnight — but they do signal their direction through behavior before the statistics fully catch up. Current behavior suggests the direction has changed.
Primary City Performance
How the 18 Primary Cities Are Performing
Primary Cities — Market Index
Greater Phoenix Metro, March 26, 2026 | Index above 110 = Seller's Market | 90–110 = Balanced | Below 90 = Buyer's Market
Market index measures the balance between supply and demand. 100 = perfectly balanced. Change reflects movement over the past four weeks. Data as of March 26, 2026.
Chandler leads the Valley at 154.5, up 5% over the past four weeks, making it the single most competitive primary market in Greater Phoenix right now. The combination of strong employment access, highly rated schools, and limited new construction in established neighborhoods continues to drive outsized demand relative to available supply.
Fountain Hills at 141.3 is a notable standout — a market that frequently gets overlooked in Valley-wide conversations but has consistently maintained strong seller conditions due to its constrained geography and desirable lifestyle positioning.
Tempe at 127.5 is the most improved primary market over the past four weeks, up 11% — the largest positive move among primary cities. Its proximity to employment, light rail access, and the ongoing strength of the South Tempe submarket are all contributing factors.
Gilbert's decline of 10% to 125.6 is worth watching. The city remains firmly in seller territory but has given back meaningful ground over the past month. Elevated new construction activity in the San Tan Valley and Queen Creek corridors directly adjacent to Gilbert is likely absorbing demand that might otherwise flow into Gilbert resale. Despite the pullback, 125.6 remains a strong seller's market reading.
Cave Creek at 109.5, down 10%, has slipped from seller territory into the balanced zone — one of the more significant directional moves among primary cities. Inventory in Cave Creek has expanded faster than in comparable communities, and the luxury price points that dominate that market have also faced more deliberate buyers in recent months.
The Price Point Story
Understanding primary city performance requires layering in price point context, because the market conditions within a single city can vary dramatically depending on what a buyer is spending.
| Price Range | Hottest Areas | Market Character |
|---|---|---|
| Under $400,000 | West Valley broadly — Avondale, Glendale, Tolleson corridors | Seller's Market — Multiple zip codes showing more under contract than active |
| $400,000 – $500,000 | Southeast Valley — Chandler, South Tempe, West Mesa, Apache Junction corridor | Hot Seller's Market — Highest contract velocity in the Valley |
| $600,000 – $800,000 | North 101 corridor — Norterra, Moon Valley, Desert Ridge, Cave Creek, North Scottsdale | Strong Seller's Market — First weekend offers increasingly common |
| $800,000 – $1,500,000 | Scottsdale, Paradise Valley, North Scottsdale | Balanced to Seller — Deliberate buyers, well-prepared homes move |
| $1,500,000+ | Paradise Valley, Scottsdale Arcadia, Silverleaf, DC Ranch | Active — Luxury up 26% YOY, ultra-luxury exceptionally strong |
| Condos under 1,100 sq ft | Valley-wide | Buyer's Market — Competing with new apartments, inventory up 11% |
The condo and townhome market deserves special mention. After a slow start to 2026, condos under contract have pulled ahead of last year by approximately 1.3% — welcome news, but not enough to offset a market that remains genuinely challenging for smaller unit sellers. Condos under 1,100 square feet are competing directly with newly built apartment complexes offering significant incentives, and have seen accumulated price declines of nearly 17% from the June 2022 peak. Larger condos and townhomes above 1,100 square feet have fared considerably better.
Secondary City Performance
Secondary Markets Are Shifting — And Nobody Is Talking About It
Secondary cities are smaller, more nimble markets. Because transaction volumes are lower, it only takes a handful of extra sales or a few new listings to move conditions meaningfully in either direction. That sensitivity is exactly why secondary markets so often signal broader shifts before the larger primary markets fully reflect them.
When I see secondary markets moving in one direction with this kind of speed and consistency, I take it seriously — and right now they are moving toward sellers faster than at any point in the past 18 months.
Secondary Cities — Market Index
Greater Phoenix Metro, March 26, 2026 | Index above 110 = Seller's Market | 90–110 = Balanced | Below 90 = Buyer's Market
Secondary cities are more volatile due to lower transaction volume. Smaller changes in supply or demand produce larger index movements. Data as of March 26, 2026.
Tolleson's 29% surge is the single most dramatic move in either the primary or secondary city data this month. A market that was sitting at 68.4 just four weeks ago now reads 88.3 — approaching balance from what was a deeply buyer-favoring position. This kind of move in a short window typically reflects a sudden contraction in available inventory combined with a cluster of new contracts. Watch Tolleson closely over the next 30 days.
Arizona City at +20% and Sun City West at +12% are similarly noteworthy. These are not markets that typically draw attention in Phoenix real estate conversations, but their speed of movement confirms the broader theme: sellers are gaining ground across a wide geographic range simultaneously, not just in the traditionally competitive corridors.
Apache Junction at 151.7 remains the strongest secondary market in the Valley and one of the strongest overall — outperforming many primary cities despite its more rural character. Affordability-driven demand combined with limited new supply continues to create intensely competitive conditions for buyers in that corridor.
Litchfield Park at −14% is the notable outlier moving against the trend. The market has weakened meaningfully over the past four weeks and now sits at 53.3 — firmly in buyer territory. If you are buying in Litchfield Park right now, the leverage that has largely disappeared elsewhere in the Valley still exists there.
El Mirage and Anthem, despite showing negative monthly movement, remain in seller territory at 134.1 and 124.5 respectively — a reminder that directional change and absolute position are two different things. Both markets are still meaningfully favorable to sellers; they have simply pulled back from stronger readings last month.
Interest Rate Update
What Happened to Mortgage Rates in March — And What to Expect in April
Here is the plain-English version of what happened: bond markets globally have been under pressure due to broader economic uncertainty. When bond prices fall, yields rise — and mortgage rates tend to follow. The expectation of near-term rate relief that many buyers and sellers were counting on heading into spring has pulled back, at least temporarily.
The practical impact for buyers is straightforward. A move from 6% to 6.43% translates to roughly a 5% increase in your monthly payment for the same purchase price. On a $500,000 home, that is approximately $125 to $150 more per month. On a $700,000 home, closer to $175 to $210 per month. For buyers operating near their qualification ceiling, this matters. For buyers with flexibility, it is a manageable adjustment rather than a fundamental change in affordability math.
What stands out most is how the market has absorbed this increase. Contract activity is still up 10% year over year despite rates moving higher. Buyers are still moving. The resilience of demand in the face of a half-point rate increase suggests that the buyers currently active in this market have largely made peace with the rate environment and are making decisions based on their personal circumstances rather than waiting for an interest rate catalyst.
What to Expect Heading Into April
Rate forecasting is genuinely difficult and anyone offering you precision on where rates will be in 30 days is overconfident. What I can say is that the conditions currently driving rates higher — global bond market pressure and economic uncertainty — will need to resolve before mortgage rates return to the 5.99% level briefly seen in February.
If rates stabilize near current levels heading into April, the contract momentum already in motion should continue building. The spring season typically accelerates activity regardless of rate environment, and the buyers who have been waiting to act may find the combination of improving inventory absorption and seasonal urgency enough to move.
If rates move meaningfully higher — toward 6.75% or above — expect some softening in the pace of new contracts as buyers recalibrate. Based on the underlying demand picture, this would likely manifest as a temporary pause rather than a reversal of trend. The buyers are there. The question is whether the rate environment allows them to act or encourages another period of waiting.
For sellers, the rate environment is less directly impactful than it is for buyers — but it matters because it affects the size of the active buyer pool at any given price point. Sellers in the $400,000 to $700,000 range where buyers are most rate-sensitive should price with current conditions in mind rather than hoping for a rate-driven demand surge in the near term.
Out-of-State Migration
Among Colorado Buyers, Phoenix Is the Top Destination — And the Broader Pool Has Never Been Wider
For years California dominated the conversation around out-of-state buyers coming to Phoenix. That conversation has expanded considerably — and the newest chapter is being written by Colorado.
When looking at buyers relocating from Denver and across the state of Colorado, Phoenix has become their most popular destination. Denver experienced one of the most significant home value run-ups in the country between 2020 and 2022, followed by meaningful price correction in several segments. A buyer who purchased in Denver in 2019 or earlier is sitting on substantial equity — and many are choosing to convert that into a lower cost-of-living, lower-tax environment with 300 days of sunshine annually.
Remote work has removed the geographic tether entirely. A buyer whose employer is headquartered in Denver but who works remotely has very little tying their housing decision to Colorado geography. Phoenix offers comparable access to major airports, a growing professional ecosystem, and home prices that — despite recent appreciation — still represent genuine value relative to what these buyers are leaving behind. Many Colorado buyers are arriving with equity, clear financial motivation, and a readiness to move decisively once they find the right property.
California, Chicago, the Bay Area, Seattle, and Minnesota
California buyers remain an exceptionally active segment, and the structural reasons driving California-to-Arizona movement have not changed. Two categories dominate. First, investors pursuing tax-deferred 1031 exchanges — sellers of California investment properties redeploying equity into Arizona to access more favorable landlord laws, lower property taxes, and stronger short-term rental economics. If you are evaluating a California-to-Arizona exchange, my 1031 exchange case study walks through a real transaction in detail. Second, household relocators exiting high-tax environments, particularly those approaching or entering retirement who are recalculating what their savings will support in a state without income tax versus one with rates approaching 13%.
Beyond Colorado and California, consistent buyer interest is arriving from Chicago, the Bay Area, Seattle, and Minnesota — each driven by their own combination of factors. Chicago buyers are frequently motivated by cost of living and retirement planning. Bay Area buyers tend to arrive with significant equity and investment orientation. Seattle and Minnesota buyers are often remote workers or retirees making a weather and lifestyle-driven decision that the Phoenix numbers make easy to justify.
The broader point is this: the Greater Phoenix buyer pool is now more geographically diverse than it has ever been. A market that draws motivated buyers from multiple major metros across the country is more resilient and more broadly supported than one dependent on a single origin. For sellers, this means your buyer may arrive from somewhere unexpected — with a different frame of reference for value, strong motivation to close on a timeline that fits their relocation, and in many cases, the equity and financial flexibility to move quickly and decisively.
That is an unambiguously positive development for anyone considering listing in 2026.
New Construction
The Builder Incentive Era Is Over — Here Is What That Means for Everyone
Last month I noted that builders were beginning to pull back on incentives. That transition has now moved from early warning to confirmed reality, and the speed of the change has been notable.
Over the past several weeks, multiple major builders operating in the Greater Phoenix market have reduced or eliminated their most prominent promotional offerings. Rate buy-down programs that were advertising 30-year fixed financing near 3.99% have been adjusted upward to approximately 4.5% — still below prevailing market rates, but a meaningful step back from where they were 60 days ago. Several builders have also concluded "build from dirt" promotions that offered buyers up to 50% discounts on design center options, and at least one builder ended a long-running rate buy-down program entirely.
Why Builders Are Pulling Back
Builders offer incentives when they need to. When the market provides enough organic demand to move inventory at acceptable margins, the incentives come off. The fact that multiple builders are reducing incentives simultaneously suggests they are reading improving market conditions — and acting on that reading before the general public fully recognizes the shift.
Builders also have a structural cost pressure argument: financing buy-downs are expensive. At 3.99%, builders were effectively subsidizing the gap between that rate and the prevailing market rate for the duration of the loan — a cost that compounds significantly on higher-priced homes. As mortgage rate stability returns, their ability to reduce that subsidy improves.
What This Means for New Construction Buyers
The calculus has shifted. Six months ago, a buyer comparing new construction to resale had a compelling financial argument for new: a below-market financing package plus design center credits could add up to $50,000 to $100,000 in effective value on a $600,000 home. That gap has narrowed considerably.
New construction still offers genuine advantages — warranty protection, energy efficiency, modern floor plans, and the ability to customize finishes. For buyers considering a 10-year or longer holding period, the total cost of ownership math still frequently favors new over resale when maintenance and efficiency are factored in. My complete guide to new construction in Phoenix covers the builder landscape, red flags to watch for, and how to evaluate incentive packages. But the decision now requires a more careful comparison than it did in late 2025.
The location reality is also shifting. As land costs push new construction further from established employment and amenity corridors, the most affordable new construction options are concentrated increasingly on the outer edges of the metro — Queen Creek, San Tan Valley, Buckeye, and Maricopa. For buyers drawn to Phoenix for affordability, remote work flexibility, or retirement, these locations are often perfectly suited to their needs. For buyers tied to employment centers in Scottsdale, Tempe, or central Phoenix, the commute math becomes a meaningful factor.
What This Means for Resale Sellers
This is one of the most meaningful competitive developments for resale sellers in the past two years, and it is not getting enough attention.
For the better part of 24 months, one of the most consistent objections resale sellers faced was the builder down the street offering below-market financing and free upgrades. A buyer walking through a resale home and then walking through a model home with a 3.99% rate promotion and $40,000 in design center credits was facing a genuinely difficult comparison. That comparison has now shifted materially in favor of resale.
A well-prepared resale home in a desirable established neighborhood, priced accurately, now competes on a more level playing field than it has since early 2024. The financing advantage that new construction commanded is compressing. The upgrade incentive that made model homes feel irresistibly turnkey is largely gone.
One additional dynamic worth noting: as builder incentives have pulled back, more resale listings have begun appearing in communities adjacent to active new construction. Sellers who previously felt they could not compete with builder promotions are beginning to list again. This adds some inventory to specific submarkets, but it also signals growing confidence among sellers who had been sitting on the sidelines — which is a healthy development for overall market liquidity.
What This Means For You
Buyers and Sellers Are Operating in Very Different Markets Right Now
For Buyers
The Window Is Narrowing — And It Is Moving Faster Than Most Expect
If you have been operating under the assumption that the market would continue moving in your favor indefinitely, the data suggests it is time to reassess that expectation — at least in certain areas and price ranges.
Properties in competitive corridors and price ranges are going under contract after the first weekend of showings with increasing frequency. Buyers I am working with right now are experiencing this firsthand. After months of being able to take their time, schedule second showings, and negotiate from a position of patience, some have missed on homes that moved before a follow-up visit was even possible. That dynamic was largely absent from this market 90 days ago.
This is not the reality everywhere. Real opportunities remain — particularly in Litchfield Park, the outer growth corridors of Buckeye, Maricopa, Queen Creek, and San Tan Valley, and in the condo market below 1,100 square feet. But assuming that every buyer in every price range still has unlimited time and leverage is a mistake that is starting to cost people homes.
Builder incentives have also moderated, which removes one of the primary negotiating alternatives buyers could point to when working on resale properties. The "I can just go buy new construction with a 3.99% rate" conversation is no longer as straightforward as it was.
The buyers who will perform best through spring are pre-approved and fully underwritten, clear on their priorities and willing to act decisively, working with a buyer's agent who has a pulse on which specific areas and price points are moving fastest, and realistic about what 6.43% financing looks like for their monthly budget. Investors specifically should also be aware that qualifying short-term rental properties continue to offer compelling depreciation advantages — my Scottsdale STR case study breaks down the bonus depreciation strategy in full. Waiting for significantly lower prices or materially better rates is a strategy the data increasingly does not support.
For Sellers
The Market Is Finally Working With You — But Execution Still Decides the Outcome
The patience I have consistently recommended is beginning to pay dividends, and March has provided the clearest evidence of that yet. The market backdrop is the most favorable it has been for sellers in the past 18 months.
Contract velocity is improving across the board. The builder competition that held resale sellers at a disadvantage for two years is easing. Out-of-state buyers are arriving from more places than ever before, many with equity and strong motivation. And the luxury market above $3 million is running 26% ahead of last year in closed transaction volume — confidence at the upper end tends to filter down through price tiers, and right now that confidence is as strong as it has been since 2022.
Despite the improving backdrop, the market will still penalize execution errors. Today's buyers are more informed than at any prior point in Phoenix real estate history. They have access to historical pricing data, days-on-market trends, and neighborhood-level supply and demand information. An overpriced home does not generate bidding wars the way it did in 2021 — it generates silence and eventual price reductions that cost sellers both money and negotiating position.
Condition matters more than it has in years. Buyers who have options — and they still do in much of the market — will consistently choose the home that shows well over the one that needs work, even at a lower price point. Investment in preparation before listing continues to generate the highest returns of any pre-sale activity.
The environment is improving. The strategy remains the same: enter the market positioned to succeed from day one. Price accurately. Present beautifully. And let the improving market conditions do the rest of the work.
The Luxury Market
Luxury Sales Are Running at Levels That Are Genuinely Surprising
The luxury market in Greater Phoenix has had an extraordinary spring season, and the numbers deserve to be highlighted specifically because they tell a story that is easy to miss in aggregate Valley-wide data.
Only through the first 10 weeks of 2026 and already 21 transactions have closed for homes priced at $10 million or more. To put that in context: in all of 2022, that number was not reached for the full year. In 2025, which was the strongest year on record for ultra-luxury transactions, the full-year total was 32 closings. 81% of that annual record has already been achieved before the first quarter has closed.
The dollar volume year-to-date for the first 10 weeks sits at $283 million for the ultra-luxury segment alone. The comparable figure for the same period in 2025 was $77 million. That is not a rounding error — it is a fundamental change in the character of the market at the upper end.
This activity is distorting average price statistics in a way that is worth understanding. The average home price in Greater Phoenix year-to-date is approximately $650,424, up nearly 3% from the same period in 2025. However, when homes above $10 million are excluded, the average drops to $627,743 — barely changed from last year. The aggregate number is being driven by a few dozen extraordinary transactions rather than broad-based price appreciation.
For most buyers and sellers operating below the $3 million threshold, the practical takeaway from luxury market strength is indirect but real: confidence at the upper end of the market tends to precede broader market strength by two to three months. Luxury buyers are typically less rate-sensitive and more economically forward-looking than the general buyer population. When they are active and transacting at volume, it tends to reflect genuine confidence in the local economy and real estate market that eventually filters down through price tiers.
There are currently 102 active properties listed above $10 million in the Arizona Regional MLS — providing continued supply for what has clearly become an exceptionally active buyer pool at that level.
Final Thoughts
The Market Is Not Announcing a Turning Point. It Is Revealing One.
Housing markets rarely announce their turning points. They reveal them gradually through behavior — through the accumulation of contract data, inventory trends, builder decisions, migration patterns, and the quiet observations of people who spend every day working within them.
March is revealing one.
Contracts are up 10% year over year. Inventory growth has stopped. Secondary markets are shifting faster than primary ones and in the same direction. Builders are pulling back incentives because they no longer need them to move product. Out-of-state buyers are arriving from more places than ever, many with equity and genuine urgency. Ultra-luxury transactions are running at a pace that would set an all-time annual record if maintained. And rate-sensitive buyers who paused in response to the brief rise from 5.99% to 6.43% appear to be re-engaging rather than retreating.
None of this means the market has fully flipped. Greater Phoenix is a large, fragmented market and generalization is always dangerous. Buyers in Litchfield Park, Buckeye, Maricopa, and the outer growth corridors still have meaningful leverage. Sellers in those same markets still need to price carefully and present well. The condo market below 1,100 square feet remains genuinely difficult for sellers. And the interest rate environment remains a variable that could moderate momentum if it moves meaningfully higher.
But the weight of the evidence in March points in one direction. The market that was defined by buyer advantage for most of the past 18 months is transitioning — not overnight, not uniformly, but clearly and consistently across enough data points to act on.
Spring has arrived. And for the first time in a while, it feels like the market arrived with it.
As always, strategy, preparation, and genuine local knowledge will continue to outperform attempts at timing this market. If you have questions about how any of this applies to your specific situation — whether you are buying, selling, investing, or simply trying to understand what your home is worth today — I am always available for a direct conversation.
Ready to Talk Through Your Situation?
Whether you are buying, selling, or evaluating an investment opportunity — let's have a real conversation about what current market conditions mean for you specifically.
Schedule a Conversation Call (480) 269-5858
Continue Reading
You May Also Find These Useful
1031 Exchange · Case Study
California to Arizona 1031 Exchange: A Real Case Study in Vistancia and Verrado
How a California investor deferred taxes and redeployed equity into two Arizona properties — the full strategy and numbers.
Read the Case Study →New Construction · Buyer's Guide
New Construction Homes in Phoenix: The Expert Buyer's Guide for 2026
Builder incentives, top communities, red flags to avoid, and what the pullback in rate buy-downs means for buyers right now.
Read the Guide →Short-Term Rental · Tax Strategy
Scottsdale STR Case Study: Bonus Depreciation and the 100% Write-Off Strategy
A real Scottsdale short-term rental acquisition broken down — bonus depreciation, cost segregation, and cash flow analysis.
Read the Case Study →
Categories
- All Blogs (302)
- Active Adult & 55 Plus Communities (14)
- Arizona Relocation Guides (19)
- Buyers (196)
- Financial Planning (53)
- General Real Estate (127)
- Income From Real Estate (54)
- Market Update (23)
- New Construction (26)
- News, Updates and Coming Soon (56)
- Real Estate Agent Financial Planning (21)
- Real Estate Investing (84)
- Sellers (102)
- Vacation and Short Term Rentals (41)
Recent Posts


About the Author
Eric Ravenscroft is a Top 1% REALTOR® across North America and one of Arizona’s most trusted real estate strategists. With 15 years of experience spanning real estate, wealth management, and investment planning, he helps clients make smarter, financially grounded decisions, from new construction and relocations to STR investments, 1031 exchanges, and long-term portfolio strategy.
Eric’s expertise has earned him industry recognition, Elite status with Real Broker, and features in major publications including the Wall Street Journal, MarketWatch, MSN, and Morningstar. Clients across the Greater Phoenix Metro rely on his clarity, strategic insight, and results-driven guidance.
Ready to make a confident real estate move? Call or text Eric today.