
Phoenix Housing Market Update — August 2026: Prices, Luxury Trends & Investor Insights for Buyers, Sellers & Investors





August is rarely when Greater Phoenix makes its biggest moves. Heat keeps casual buyers away, sellers often wait for fall, and transaction volume typically thins out, which is exactly why this month's numbers need more context than usual before anyone draws a conclusion from them.
Taken individually, none of this month's developments looks dramatic. Prices eased, but far less than one common measurement suggests. Luxury sales are now large enough to bend Valley-wide averages on their own. Buyers under $400,000 are getting seller concessions at a remarkably high rate, and the Northeast Valley keeps pulling away from the Valley's more affordability-sensitive submarkets. Pre-foreclosure activity ticked up, worth watching, though still historically low. And investors racing a year-end tax deadline are finding fewer turnkey short-term rentals than expected.
Put together, these threads say considerably more about where Greater Phoenix is heading into fall than any single headline number does.
One Valley, several very different markets.
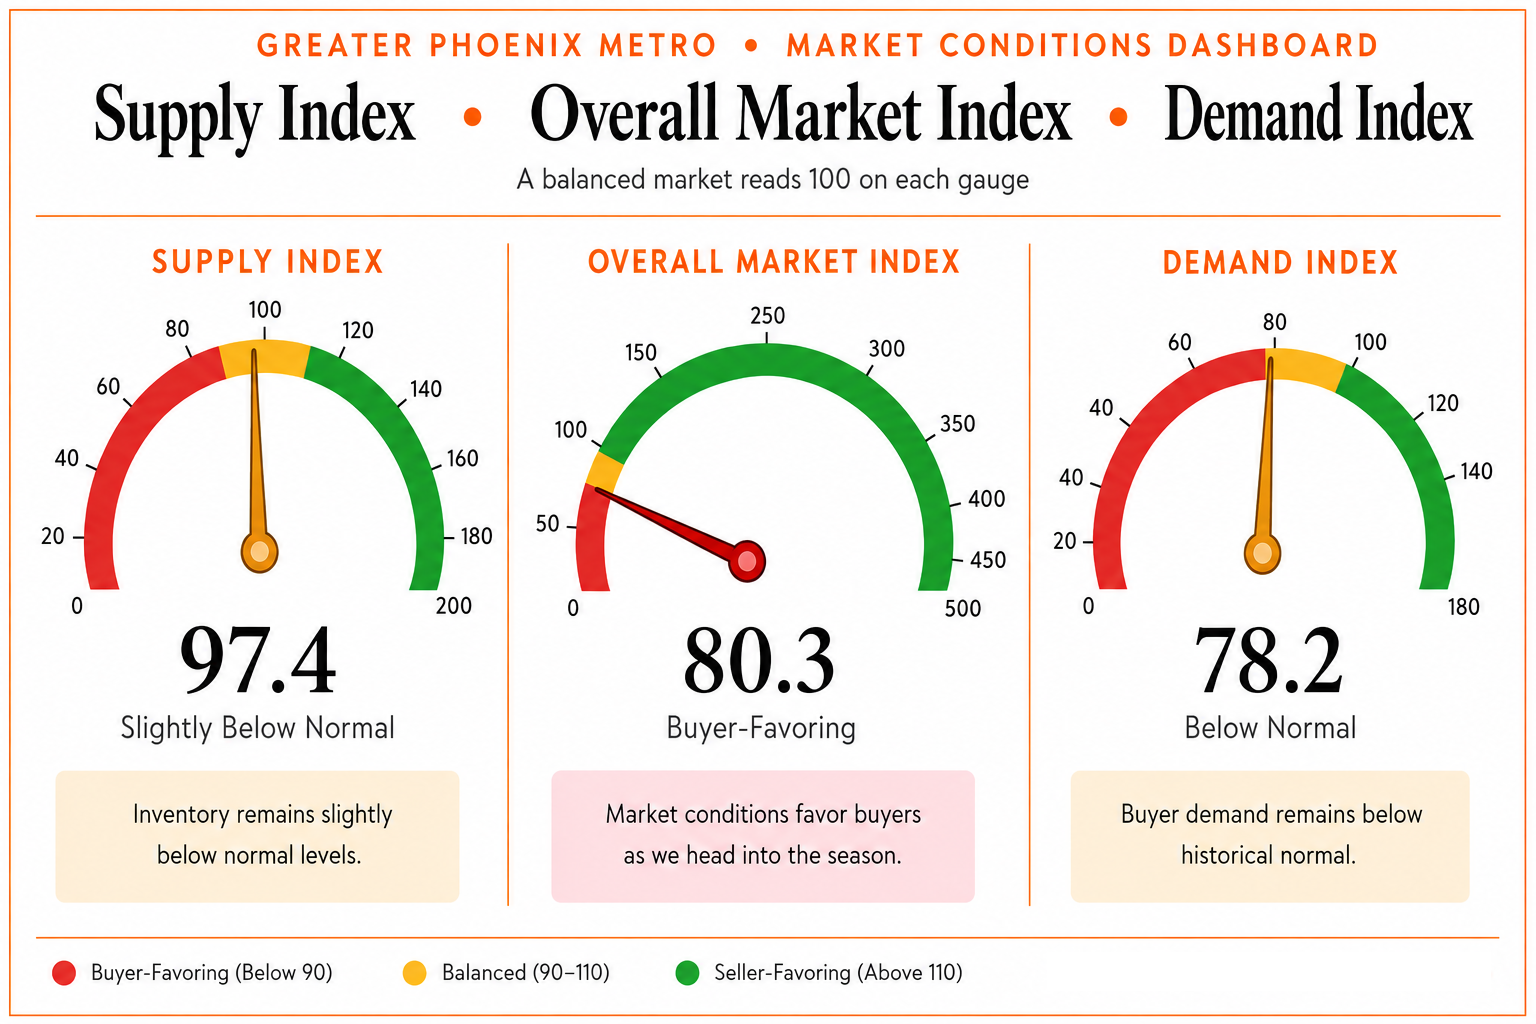
The Valley-wide Market Index sits at 80.3, buyer-favorable territory overall. But that average hides a widening split. Conditions improved for sellers over the past month, and almost none of that improvement was evenly spread.
Much of the strength has come from the Northeast Valley. Paradise Valley has been one of the strongest contributors, while Scottsdale and Fountain Hills have also experienced meaningful improvement. The differences are substantial: Paradise Valley currently sits at 212.1, followed by Fountain Hills at 192.3 and Scottsdale at 153.5. Chandler also remains relatively strong at 139.5.
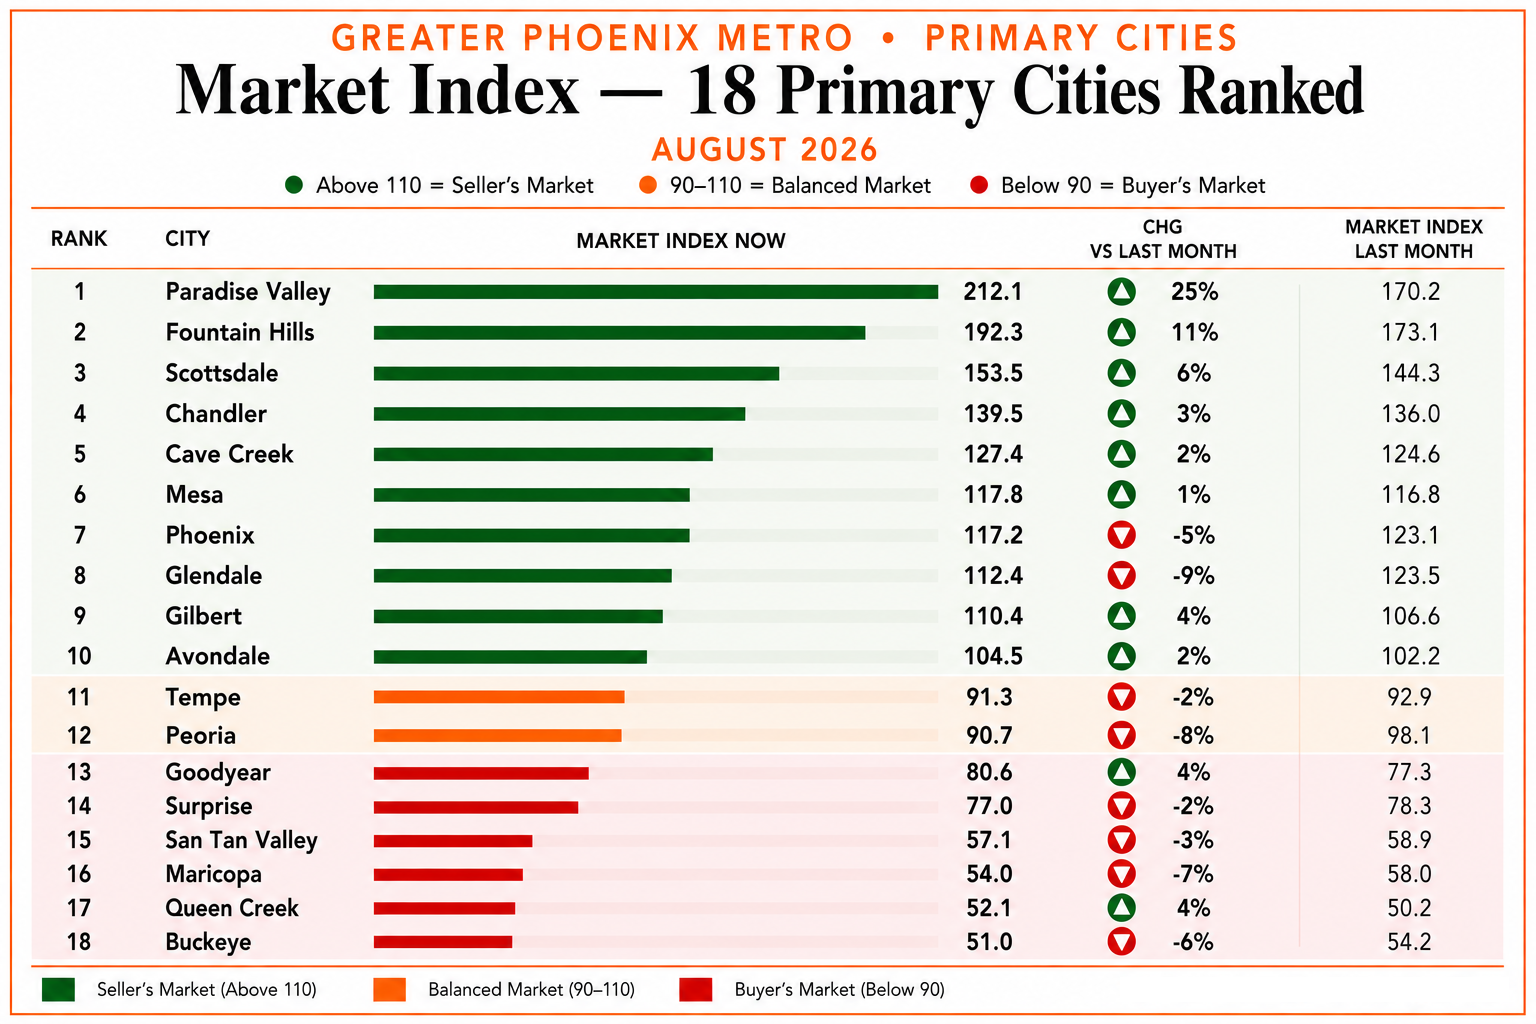
Meanwhile, Phoenix currently sits at 117.2 after declining 5% over the past month. Glendale declined 9% to 112.4, while several affordability-sensitive markets remain well below balanced conditions: Goodyear at 80.6, Surprise at 77.0, Maricopa at 54.0, Queen Creek at 52.1, and Buckeye at 51.0.
The smaller markets are equally mixed. Anthem has strengthened significantly over the past month, while Sun City West and Gold Canyon have also moved meaningfully in sellers' favor. Laveen and El Mirage have moved sharply in the opposite direction.
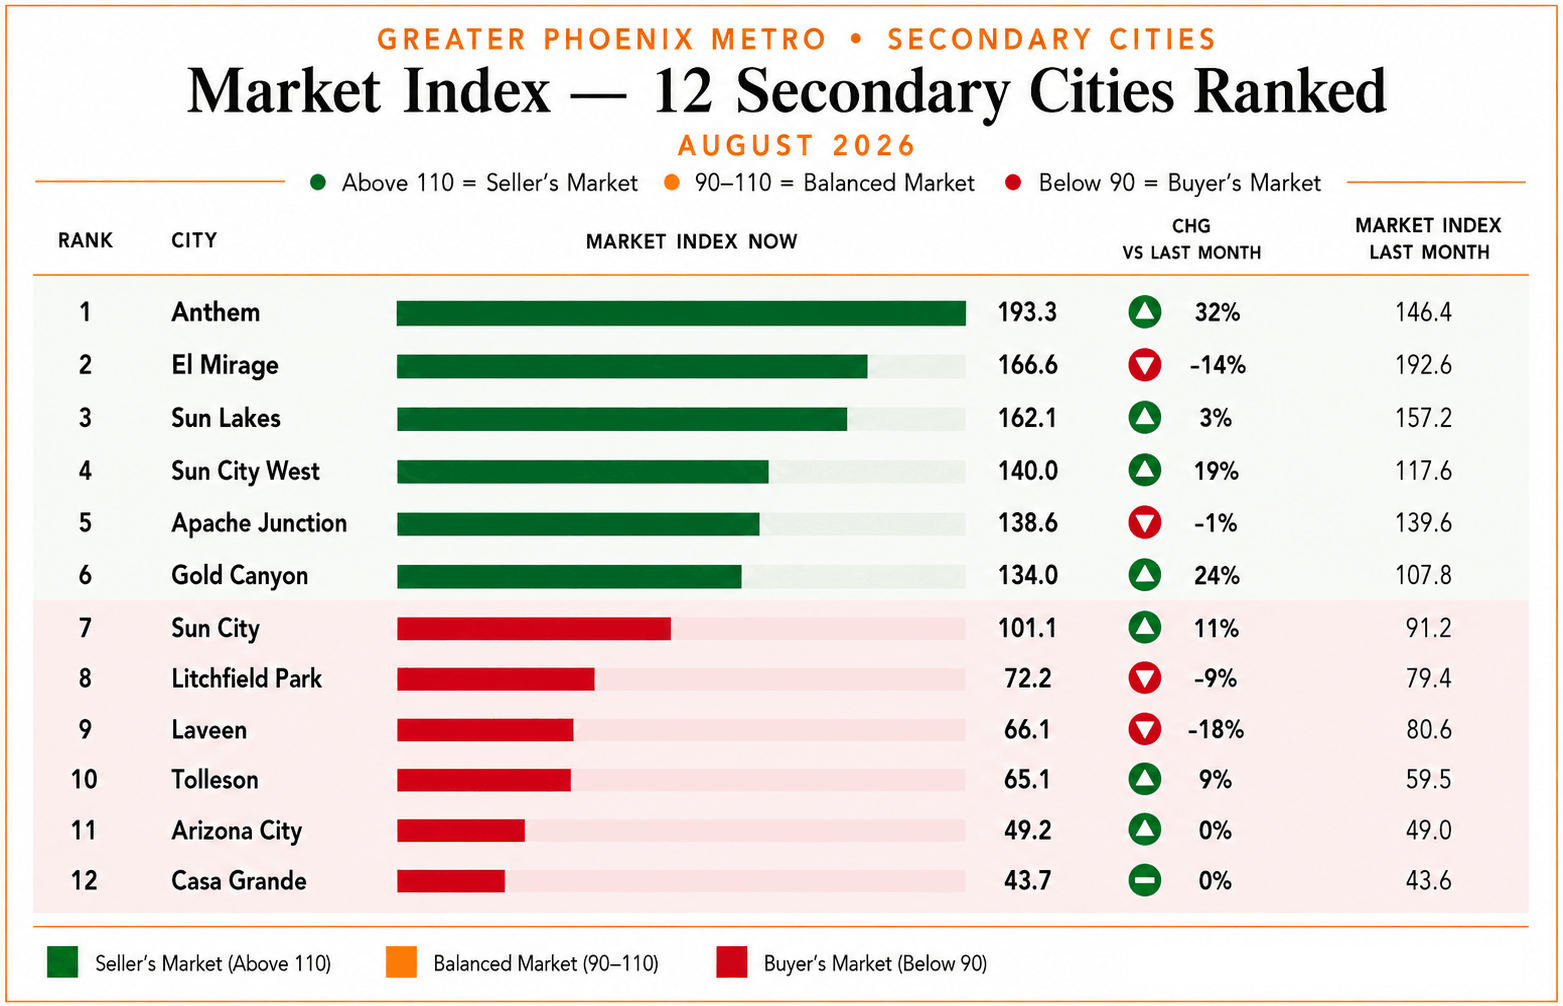
Some of this is seasonal. Active inventory has declined in several communities popular with winter visitors and active adults, as sellers there frequently pull listings during the hottest months and return as temperatures moderate, temporarily thinning competition. As that inventory returns in the coming weeks, we'll get a cleaner read on how much of this month's strength was demand and how much was a temporary supply gap.
The number you saw in the headline probably overstated this.
This month's most interesting development isn't where prices moved. It's how differently two ways of measuring the same market tell the story.
The overall median sales price barely moved, from $451,000 to $449,900, and remains above the $440,000 recorded a year ago. The gap between the two measurements comes almost entirely from what's happening at the top of the market: average price per square foot swings hard when the mix of multimillion-dollar closings shifts from one month to the next, while the median absorbs that noise. In July, roughly 62% of Greater Phoenix closings sold below the average price per square foot, a reminder of how far above the typical buyer's experience that average can sit.
Forward-looking data agrees with the calmer story. Pending listings show a median price per square foot of $253.42 as of August 15, and the September forecast points to roughly $251, modest softening, consistent with summer typically being the year's weakest pricing period, not the start of a sharper correction.
Above $2 million, this isn't the same housing cycle.
The growing pull of luxury sales on Valley-wide averages isn't a statistical accident. The segment itself has been genuinely resilient. As of July, the Northeast Valley's median price per square foot for single-family detached homes sat only about 1% below its May 2022 peak. The West Valley, over the same span, remained roughly 12.8% below its 2022 level.
Below $2 million
Approximately 10% below the May 2022 median price per square foot, still working through the post-2022 correction.
Above $2 million
Nearly 5% higher than May 2022, and only about 6.5% off an all-time high reached earlier this year.
Volume tells the more convincing part of the story. The $2 million-plus segment averaged roughly 115 closings a month in 2022; through 2026 that's climbed to about 178 a month, up roughly 55%. This isn't a handful of trophy sales skewing the data. It's meaningfully more high-end transactions happening every month. Higher-end buyers also tend to be less rate-sensitive, often using larger down payments, cash, or alternative financing, which puts them in a very different demand environment than buyers whose purchasing power shifts every time rates move half a point.
The median price isn't what most first-time buyers actually need.
Through 2026, the median Greater Phoenix single-family home has run about 2,001 square feet at roughly $450,000, a useful benchmark, and considerably more house than many first-time buyers are shopping for.
- •Among $300,000 to $400,000 closings over the past three months, about 70% included seller-paid buyer closing costs, with a median seller contribution near $10,485.
- •Depending on the loan structure, those concessions can reduce upfront costs or be applied toward a lower mortgage rate and monthly payment.
- •Growth corridors like Buckeye, Surprise, Queen Creek, and parts of Pinal County continue offering new construction near or below the Valley median, often paired with builder financing incentives.
Two very different paths to the same monthly payment
A $375,000 resale with a meaningful seller concession, and a $400,000 new-construction home with below-market financing, can both pencil out better than the $450,000 Valley median implies. Rates remain a real obstacle, but the headline median doesn't show what's actually purchasable, what's negotiable, or what the final payment looks like. Those are the numbers that matter.
Slower isn't the same as wrong.
Summer showings decline every year, homes sit longer, and days-on-market climbs. The question is whether a specific listing needs to change, or whether the whole price segment is simply moving through its usual seasonal lull. The most useful signal right now is narrow, not Valley-wide: showing activity among directly competing listings, how many new contracts are being written each week nearby, and the price at which comparable homes are actually going under contract.
If comparable homes are getting offers and one listing isn't, something about price, condition, presentation, or terms likely needs to change. If nothing nearby is going under contract, repeated price cuts on one home may accomplish very little. That distinction gets more important by the week. By late September, additional listings typically return to the market, meaning today's sellers may be facing less competition right now than they will in a month.
The 2026 short-term rental tax window is closing.
The return of 100% bonus depreciation has pulled real interest toward short-term rental strategies this year, particularly among higher-income W-2 earners layering in cost segregation and material-participation rules. As September opens, the calendar becomes the binding constraint.
That timeline is precisely why turnkey inventory matters so much right now, and why this summer's supply of it has run thinner than expected. In case after case this summer, owners who considered selling saw stronger-than-expected bookings and chose to keep operating rather than list. That's left buyers working against a year-end deadline with fewer quality, established options than usual for this point in the year, though a pickup in listings looks likely through September as more owners recognize the demand tied to the tax timeline. See how recent investor clients have navigated this in our Phoenix real estate case studies.
A well-run turnkey property carries real value beyond the furniture: existing amenities, operating history, reviews, management systems, and future bookings all remove execution risk for a buyer with limited runway. That doesn't mean every existing rental deserves a premium. The underlying real estate, revenue history, expenses, and regulatory picture still matter. Cost segregation, material participation, and bonus depreciation are each separate rules with their own requirements, not one bundled benefit, and eligibility should be worked through with a CPA before any purchase decision leans on the tax outcome. For the fuller picture, see our real estate tax strategy guide, including how depreciation, 1031 exchanges, and step-up in basis fit together in our deeper breakdown. Not sure whether long-term, mid-term, or short-term is the right fit for a given property? Our Phoenix rental strategy guide walks through the trade-offs.
An early signal, not a warning.
Pre-foreclosures now account for roughly 3.9% of listings under contract and lender-owned properties about 1.5%, both up modestly and worth tracking over the next few months. Context matters here more than almost anywhere else in this report: during 2011 and 2012, normal transactions fell below 25% of the market, and even from 2013 through 2019 they averaged only about 85%. Today's 94.6% remains far closer to a healthy market than a distressed one, and low lender-owned inventory suggests most struggling homeowners are still able to sell before foreclosure becomes necessary. If the pre-foreclosure trend keeps climbing through the rest of 2026, it will deserve a closer look. At today's level, calling it a foreclosure crisis would significantly overstate the data.
Adjusted for inflation, the correction looks bigger and more uneven.
Measured from the first-half-2022 peak, single-family detached homes across Greater Phoenix sit about 10% below their peak median price per square foot in nominal terms. Adjust for inflation, and the picture splits sharply by home size.
Smaller, entry-level homes, the segment most relevant to first-time and affordability-conscious buyers, have genuinely gotten less expensive in real terms since 2022. That doesn't solve affordability on its own; mortgage rates remain well above where they sat earlier in the decade and continue to shape monthly payments. But it does mean entry-level pricing has adjusted more than nominal statistics alone suggest. Zoomed out further, Greater Phoenix values remain well above where they stood seven and ten years ago across every major size category. This is a correction and normalization from an unusually competitive period, not a reversal of the Valley's longer-term appreciation.
The Valley-wide numbers rarely match any one buyer's or seller's reality.
For Buyers
Where you're shopping matters more than the Valley average. Buckeye, Maricopa, Surprise, and parts of Pinal County are a fundamentally different negotiation than Scottsdale or the Northeast Valley, and resale versus new construction changes the math again. Rather than asking whether Phoenix overall is a good time to buy, look at where price, financing, concessions, and property quality line up in your favor. If you're moving in from out of state, our Phoenix relocation resource is a good place to start. And if the Valley median has kept you on the sidelines, it's worth a closer look at what your actual budget can reach below it.
For Sellers
The question isn't whether your home has sat longer than expected. It's whether buyers are choosing something else instead, and why. That might be price, but it could just as easily be condition, presentation, concessions, or how you compare to nearby new construction. Additional inventory is likely to return as temperatures ease, so sellers already on the market may have less competition today than in a few weeks. The goal isn't just staying listed until a buyer appears. It's positioning to become the next comparable sale rather than competing against it. Our listing strategy approach walks through exactly how we do that.
September should tell us more than August did.
Inventory sits at the top of the watch list. As seasonal and active-adult sellers return, the balance between new supply and buyer demand will determine whether the recent gains in cities like Paradise Valley and Fountain Hills can hold. Mortgage rates remain the other major variable, especially in affordability-sensitive submarkets, where even a small move can shift purchasing power. The West Valley and Pinal County are worth watching closely, where buyers currently hold real leverage against continued builder competition, while the Northeast Valley's luxury strength will say a lot about how the top of the market closes out the year. And two smaller threads deserve continued attention: whether turnkey short-term rental supply picks up as the year-end deadline nears, and whether pre-foreclosure activity keeps climbing.
Talk to Eric about where you fit into this market.
Every property and every goal is different, and the Valley-wide numbers in this report can only tell you so much. A short call is usually the fastest way to find out what today's market actually means for your specific budget, timeline, or listing.
The market didn't change much in August. How we measure it did.
The real takeaway isn't that Greater Phoenix suddenly got stronger or weaker. It's that some of the shorthand statistics used to describe it are starting to mislead on their own.
Average pricing is being pulled by an unusually active luxury segment. Median pricing doesn't show the financing help available below it. Valley-wide supply and demand numbers can't capture the distance between Paradise Valley and Buckeye. And standard sales data says almost nothing about the calendar pressure facing short-term rental investors right now. None of that makes the broader numbers useless. It means they need context, and that context only gets more important heading into fall. Inventory should begin normalizing, buyers will have more to choose from, and sellers will face a different competitive set. Investors working toward a year-end deadline, meanwhile, have progressively less room to wait.
For buyers, sellers, and investors alike, the advantage this fall belongs to whoever understands the specific conditions around their decision, not just the headline.
Phoenix's preferred agent for leading financial institutions.
Eric is a preferred real estate partner for USAA, Chase, SoFi, PennyMac, Citibank, Citizens, Huntington, and Fifth Third, a reflection of his standing among the industry's most trusted advisory professionals.








From portfolio management to property.

Eric spent the early part of his career as a Director of Wealth Management, building and managing investment portfolios: allocation strategy, risk modeling, and the discipline of underwriting an asset before committing capital to it. That background is unusual in real estate, where most advisors come from sales rather than finance, and it still shapes how he approaches real estate and financial planning today.
He's now a full-time real estate advisor and owner of The Ravenscroft Group at Real Broker, ranked in the Top 100 agents in the Phoenix Metro and the Top 1% nationwide, with more than $100M in closed transactions. He works with first-time buyers, out-of-state and California investors executing 1031 exchanges into the Phoenix metro, short-term rental and investment property buyers, new-construction purchasers, relocation clients, and buyers in 55+ communities. He also hosts The House of Ravenscroft, a podcast connecting real estate and financial planning.
Questions about a specific property, submarket, or short-term rental timeline are welcome anytime. Learn more about Eric's background on his full agent profile.
Phoenix housing market: common questions.
Answers below reflect Greater Phoenix market conditions as of August 2026. For guidance specific to your situation, reach out directly.
What is the Phoenix Market Index and what does 80.3 mean?
The Market Index measures the balance between supply and demand in a given area. A reading of 100 represents a balanced market; above 100 favors sellers, and below 100 favors buyers. At 80.3, Greater Phoenix overall remains buyer-favorable, though individual cities vary widely: Paradise Valley sits at 212.1 (strongly seller-favorable) while Buckeye sits at 51.0 (strongly buyer-favorable).
Are Phoenix home prices going down in 2026?
Modestly, and less than some headlines suggest. Median price per square foot fell about 1.1% in the monthly period ending August 15, and the median sales price was essentially flat at $449,900, still above last year's $440,000. A separate measurement, average price per square foot, dropped 3.6% over the same period, but that figure is skewed by the mix of luxury sales and doesn't reflect what most buyers actually experienced.
Why is Phoenix's luxury real estate market outperforming the rest of the Valley?
Homes above $2 million are now priced nearly 5% above their May 2022 peak, while homes below $2 million remain roughly 10% below theirs. Monthly closings in the $2M+ segment have grown from about 115 in 2022 to roughly 178 today, a genuine increase in high-end demand, not just a handful of outlier sales. Luxury buyers are also generally less sensitive to mortgage rates, often using cash or alternative financing.
What seller concessions are common in Phoenix right now?
Among closings between $300,000 and $400,000 over the past three months, about 70% included seller-paid buyer closing costs, with a median contribution near $10,485. Depending on the loan, that can reduce upfront costs or be applied toward a lower mortgage rate and monthly payment, a meaningful factor for buyers below the Valley median price.
When is the deadline for 2026 short-term rental tax benefits in Phoenix?
To potentially use bonus depreciation for the 2026 tax year, a property generally needs to be placed in service, not just closed on, by December 31, 2026, in addition to meeting material-participation requirements. Because renovating and furnishing a resale into an operating rental takes time, many investors are now prioritizing turnkey, already-operating properties to meet the deadline. Eligibility should always be confirmed with a CPA.
Is Phoenix headed toward another foreclosure crisis?
No. Current distress remains historically low. Normal transactions make up about 94.6% of listings under contract, down modestly from 97.5% a year ago, with pre-foreclosures at roughly 3.9%. For comparison, normal transactions fell below 25% during 2011 and 2012. The recent uptick is worth monitoring, but today's levels are far closer to a healthy market than a distressed one.
More From Eric Ravenscroft.
A fuller library of guides, strategy breakdowns, and client stories, for whenever the next question comes up.
Client wins in Phoenix real estate
Real transactions, real numbers: how recent buyers and investors navigated this market.
Arizona new construction & developments
Where builder incentives and new inventory are changing the affordability math.
Short-term rentals & vacation homes
What makes a rental property actually work as an investment in Greater Phoenix.
Real estate tax strategy
Depreciation, cost segregation, and structuring a purchase around the tax outcome.
Real estate & financial planning in Arizona
Where property fits alongside the rest of a client's portfolio.
Full agent profile
Background, credentials, and how Eric works with buyers, sellers, and investors.
Real Estate as an Asset Class
A wealth manager's guide to underwriting property the way you'd underwrite any other investment.
Real Estate Tax Strategy: 2026 Scenarios
Worked examples of how depreciation and structuring decisions play out for real buyers.
Depreciation, 1031 Exchanges & Step-Up in Basis
How the three tools fit together across a hold, a sale, and an inheritance.
1031 Exchange: California to Arizona
What out-of-state investors need to know before moving equity into Phoenix.
Short-Term Rental Tax Break for W-2 Earners
How salaried buyers can still qualify for real estate professional tax treatment.
Phoenix Rental Strategy Guide: LTR, MTR & STR
Choosing between long-term, mid-term, and short-term rental strategies for a given property.
Categories
- All Blogs (321)
- Active Adult & 55 Plus Communities (16)
- Arizona Relocation Guides (30)
- Buyers (211)
- Financial Planning (60)
- General Real Estate (139)
- Income From Real Estate (59)
- Market Update (26)
- New Construction (28)
- News, Updates and Coming Soon (57)
- Real Estate Agent Financial Planning (22)
- Real Estate Investing (94)
- Sellers (106)
- Vacation and Short Term Rentals (45)
Recent Posts





About the Author
Eric Ravenscroft is a Top 1% REALTOR® across North America and one of Arizona’s most trusted real estate strategists. With 15 years of experience spanning real estate, wealth management, and investment planning, he helps clients make smarter, financially grounded decisions, from new construction and relocations to STR investments, 1031 exchanges, and long-term portfolio strategy.
Eric’s expertise has earned him industry recognition, Elite status with Real Broker, and features in major publications including the Wall Street Journal, MarketWatch, MSN, and Morningstar. Clients across the Greater Phoenix Metro rely on his clarity, strategic insight, and results-driven guidance.
Ready to make a confident real estate move? Call or text Eric today.