
Phoenix Housing Market Update: Prices Turn Positive as Buyers Gain the Upper Hand
Phoenix Housing Market Update: Prices Turn Positive as Buyers Gain the Upper Hand
Phoenix just posted its first year-over-year price gain since May 2025, yet today's market has shifted further toward buyers. Here's what's really happening across the Valley heading into fall 2026, city by city, and what it means for your next move.

After an unusually quiet summer, September was supposed to give us a clearer read on the Greater Phoenix housing market, and it has. Inventory is rebuilding as temperatures cool, seasonal buyers are coming back, builders are sweetening incentives ahead of fiscal-year deadlines, and mortgage rates have moved sharply higher again.
What makes this month especially interesting is that the numbers aren't all pointing the same way. The latest S&P Cotality Case-Shiller Home Price Index shows Phoenix back in positive year-over-year territory for the first time since May 2025. At the same time, real-time market indicators have weakened noticeably for sellers, with demand running well below normal and negotiating power tilting further toward buyers.
The explanation is mostly about timing. Case-Shiller is a lagging indicator. This week's release covers sales from May through July, so the typical transaction in that data closed around mid-June. Today's market is more than three months ahead of what those numbers describe. If you follow these updates monthly, you'll find every prior report on my Phoenix housing market updates page.
- Prices are stabilizing. Case-Shiller shows Phoenix up 0.05% year over year, ending 13 straight months of annual declines.
- Buyers have more leverage today. The Greater Phoenix Market Index fell to 76.9, and 15 of the 18 largest cities moved in the buyer's favor this month.
- The issue is demand, not oversupply. Supply is almost perfectly balanced at 100.3, while demand sits well below normal at 77.2.
- Mortgage rates jumped. The 30-year fixed climbed from 6.76% to 7.03% in two weeks, cooling buyer activity.
- Builders are motivated. October fiscal-year deadlines are driving some of the strongest new-construction incentives of the year.
- Location matters more than ever. Scottsdale remains firmly seller-favoring while Buckeye, Queen Creek and Maricopa are strong buyer's markets.





Trusted By
Scottsdale & Phoenix's Preferred Agent for
Leading Financial Institutions
I'm a preferred real estate partner for USAA, Chase, SoFi, PennyMac, Citibank, Citizens, Huntington, and Fifth Third, institutions that refer clients to me because they trust the strategy behind the property, not just the sale.








The fall market is shifting toward buyers
Heading into September, the big question was what would happen once homeowners started listing again after summer. In August, inventory dipped in many communities popular with seasonal residents and active adults. With fewer homes competing, the sellers who stayed on the market enjoyed temporarily better conditions.
September was the real test. With some of that inventory back, the market has moved meaningfully in the buyer's direction.
Here's the important nuance: Greater Phoenix does not have an oversupply problem. Measured against historical norms, supply sits almost exactly at the balanced-market level. Today's buyer-favoring conditions are being driven by soft demand, not a flood of listings.
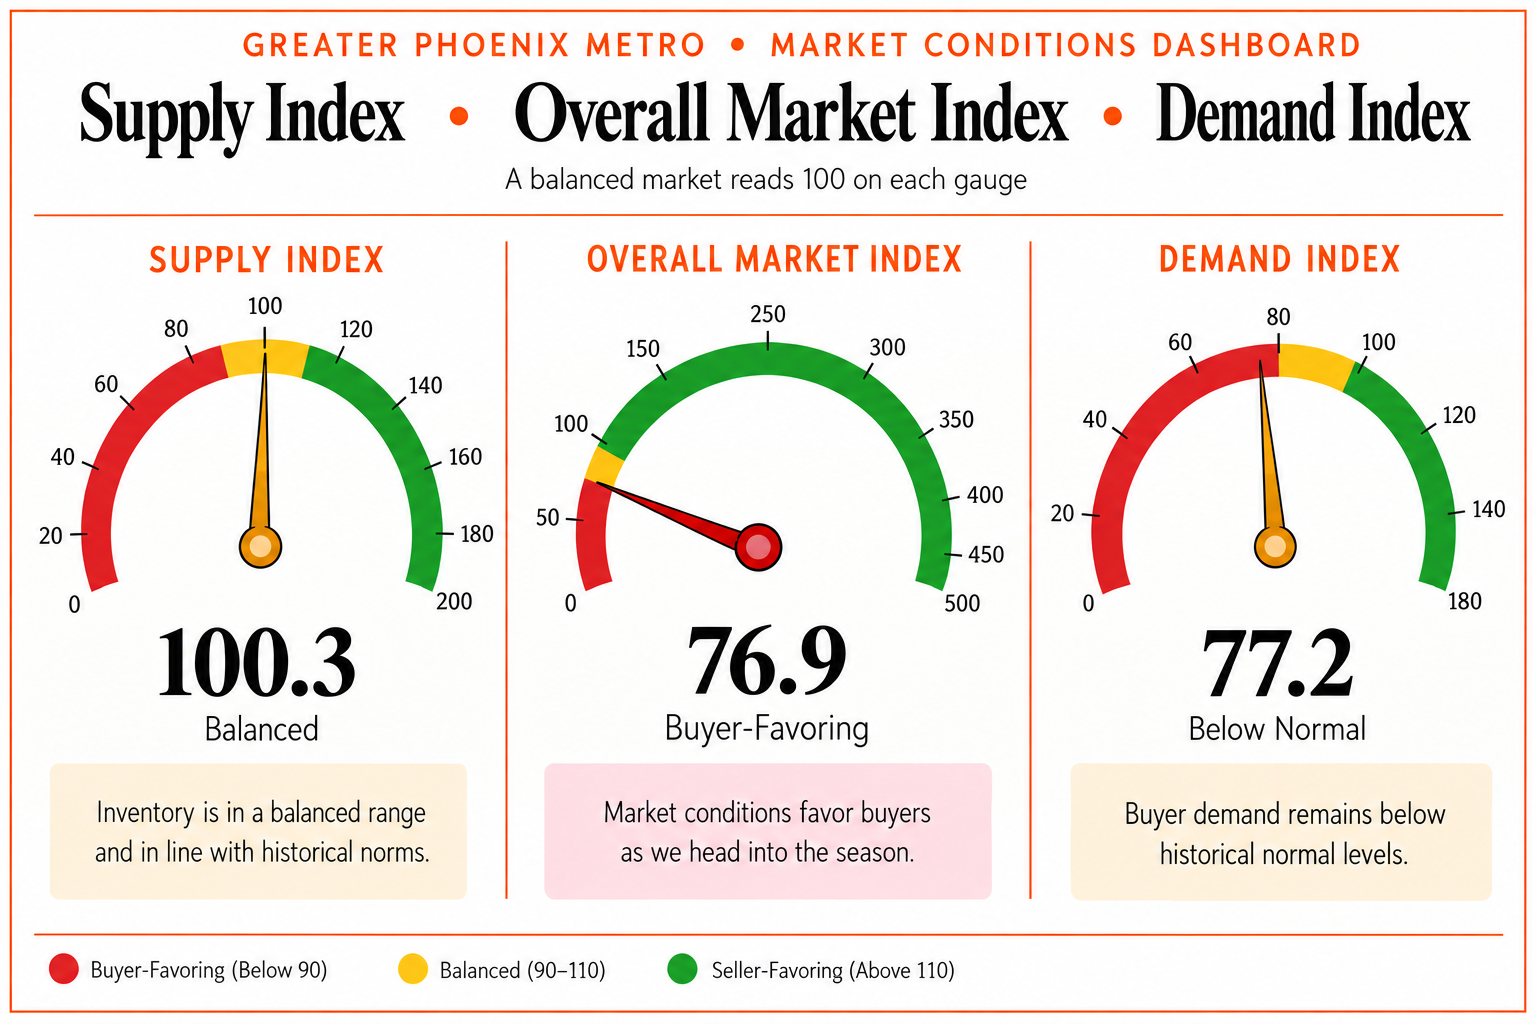
"Inventory is rebuilding as expected after summer, but today's buyer-friendly conditions are coming from below-normal demand rather than an unusual amount of supply."
Mortgage-rate volatility is a big part of that softness, though its impact varies considerably from one community to the next. Across the 18 largest cities in Greater Phoenix, the average Market Index fell roughly 7.8% in a single month, and 15 of those 18 cities moved in a buyer-favorable direction.
A Valley of very different markets
Some of the biggest shifts happened in areas that had been among the Valley's strongest. Paradise Valley fell 22% during the month, Fountain Hills dropped 20% and Tempe slid 19%. Scottsdale was the notable exception, actually improving 3% to 157.8.
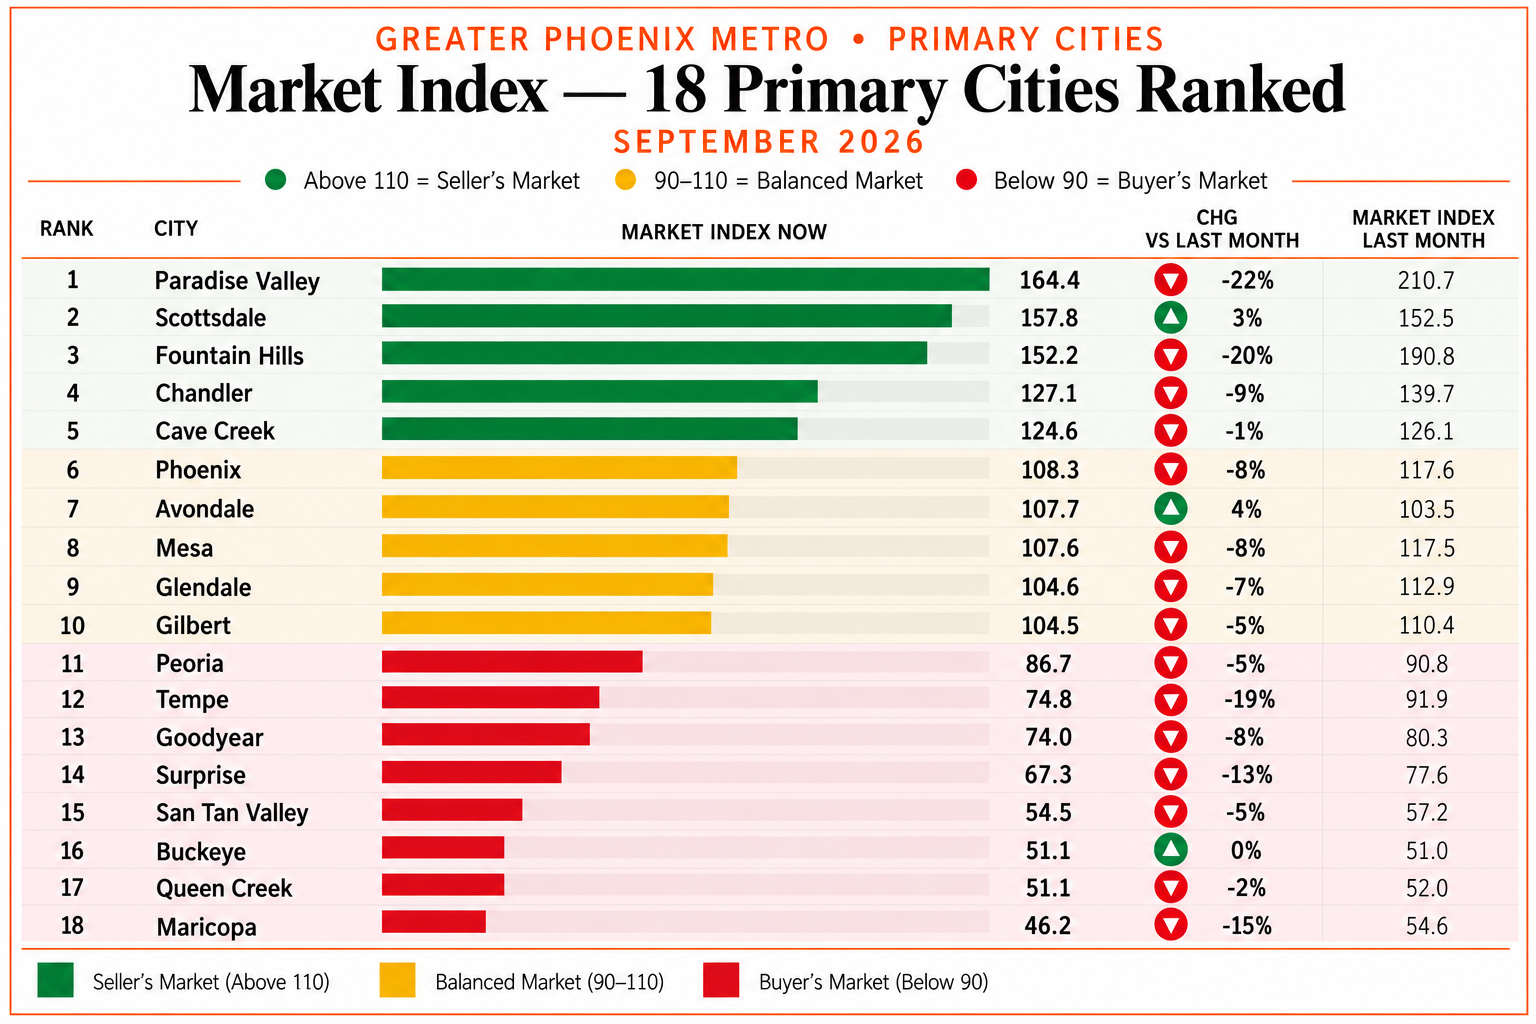
Where each of the 18 primary cities stands
Paradise Valley, Scottsdale, Fountain Hills, Chandler, Cave Creek
Phoenix, Avondale, Mesa, Glendale, Gilbert
Peoria, Tempe, Goodyear, Surprise, San Tan Valley, Buckeye, Queen Creek, Maricopa
Two of the Valley's biggest markets crossed an important line this month. Phoenix dropped 8%, from 117.6 to 108.3, sliding out of seller territory and into a balanced market. Mesa made nearly the identical move, falling from 117.5 to 107.6.
| City | Market Index | Monthly Change | Condition |
|---|---|---|---|
| Paradise Valley | 164.4 | −22% | Seller |
| Fountain Hills | 152.2 | −20% | Seller |
| Tempe | 74.8 | −19% | Buyer |
| Maricopa | 46.2 | −15% | Buyer |
| Surprise | 67.3 | −13% | Buyer |
| Phoenix | 108.3 | −8% | Balanced |
| Scottsdale | 157.8 | +3% | Seller |
Smaller Valley markets are just as varied
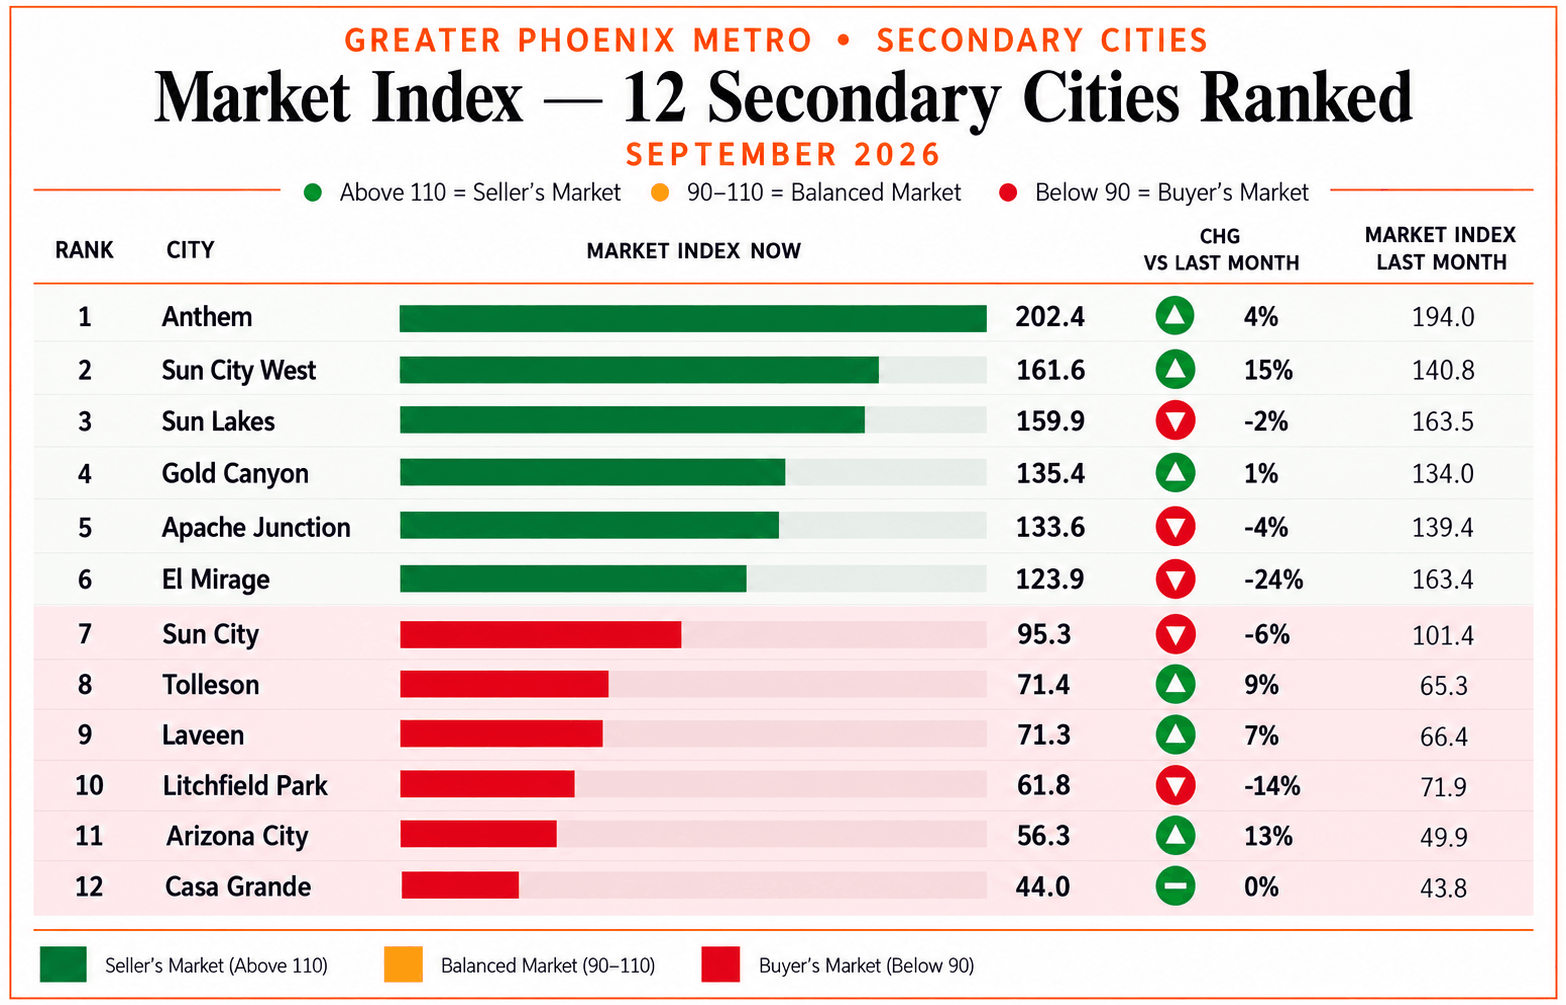
Six of the 12 secondary cities remain seller-favoring, led by Anthem at 202.4, Sun City West at 161.6 and Sun Lakes at 159.9. Sun City is the only balanced secondary market at 95.3, while the remaining five favor buyers.
Month-over-month movement was all over the map. Sun City West improved 15%, Arizona City gained 13%, Tolleson rose 9% and Laveen climbed 7%. On the other side, El Mirage dropped 24% and Litchfield Park fell another 14%.
A seller in Scottsdale is operating in a fundamentally different market than a seller in Buckeye, even though both homes are technically part of "the Phoenix housing market." Valley-wide headlines rarely tell you what's happening on your street.
Phoenix home prices return to positive territory
The newest Case-Shiller release is a useful contrast to today's softer conditions. Just remember that it covers May through July sales, so it reflects the market as of roughly mid-June, not September.
Phoenix home prices rose 0.15% from June to July, ranking sixth among the 19 reporting metro areas and edging past the national monthly gain of 0.12%. That's a big jump from the previous report, when Phoenix ranked 17th. Only seven metros posted monthly increases at all, and Phoenix and Las Vegas were the only western markets among them. San Francisco, Seattle, Los Angeles, Denver, Portland and San Diego all declined.
The year-over-year number is the headline. Phoenix prices were 0.05% higher than July 2025, putting the Valley back into positive annual appreciation for the first time since May 2025 and ending 13 consecutive months of year-over-year declines.
Let's keep it in perspective. A 0.05% gain is essentially flat. Phoenix still trails the national annual increase of 1.93%, and prices remain about 4.9% below the June 2022 peak. Even so, turning positive after more than a year of declines is a meaningful milestone.
Why stable prices don't mean sellers have the leverage
Phoenix has spent several years digesting the extraordinary run-up of 2020, 2021 and early 2022. Much of the correction since then has been concentrated in smaller, more affordability-sensitive homes, while larger luxury properties have followed a very different path. The latest data suggests nominal prices may be stabilizing.
That doesn't mean sellers are regaining control. Home values can hold steady while sellers face more competition, longer marketing times and more pressure to offer concessions. Prices are usually the last thing to react; supply, demand, contract activity and price reductions move first.
Mortgage rates became September's biggest headwind
The most consequential change this month was the cost of financing. According to Freddie Mac, the average 30-year fixed mortgage rate rose from 6.76% on September 10 to 7.03% by September 24, and more real-time measures moved even higher.
The speed of that increase is what matters most. Buyers have shown repeatedly over the past few years that homes will sell with rates above 7%. What disrupts demand is rapid change. A buyer comfortable with a payment at one rate may need to rethink their price range a few weeks later, and others simply pause their search until rates settle.
A one-percentage-point change in mortgage rates can move a principal-and-interest payment by roughly 10%, depending on the loan. Even a half-point increase can meaningfully change what a home costs each month, without the price changing at all.
This also explains how the market can weaken for sellers while a lagging measure like Case-Shiller improves. The sales behind July's Case-Shiller numbers largely happened before September's jump in borrowing costs.
Seller concessions are quietly doing a lot of work
Depending on the deal, those dollars can cover closing costs or fund rate buydowns that lower the buyer's monthly payment. Prices have held up well, but the terms underneath those prices favor buyers more than the headline numbers suggest. If you want to test how a buydown or concession changes your payment, my investment and mortgage calculators are a good place to start.
Snowbirds are returning, and so are sellers
Seasonal activity is starting to show up across the Valley. I'm already seeing more snowbird and seasonal buyers among my own clients beginning their searches ahead of winter. That's typical as temperatures cool, especially in Scottsdale, the Northeast Valley, active-adult and golf communities, and areas with strong second-home demand.
The difference this year is that those buyers are arriving at the same time as more homes hit the market. Active inventory rose in September across most of the smaller markets I track and in many of the larger cities, and in several areas that increase came alongside weaker demand. Unlike the summer, when shrinking inventory in seasonal communities helped sellers, supply is currently recovering faster than demand.
October and November will tell us how much seasonal demand can change that. If buyer activity accelerates, some of today's inventory will be absorbed. If demand stays below normal, winter buyers could have considerably more negotiating power than is typical during the Valley's peak season. If you're planning a seasonal or permanent move, my guide to moving to Arizona from out of state covers the neighborhoods and logistics.
Builder incentives are heating up
Some of the most compelling opportunities I'm seeing for buyers right now are in new construction. Several builders operating in Greater Phoenix have fiscal-year deadlines in October, and incentives have increased as those dates approach. Depending on the community, buyers may find a combination of price reductions, closing-cost help and below-market financing that an individual resale seller would struggle to match.
Where it can win
- Subsidized, below-market financing can lower the monthly payment even at a higher price
- Closing-cost assistance and price reductions near fiscal-year end
- New systems, builder warranties and fewer near-term repairs
Where it can win
- Often a lower asking price in the same area
- Landscaping, window coverings, appliances and pools already included
- Established neighborhoods and more room to negotiate concessions
The smartest comparison isn't price against price. It's the total cost of owning each home.
Arizona's construction pipeline is shifting outward
Arizona issued 2,097 single-family building permits in August, only 2.8% fewer than August 2025. That's a big improvement from the 20% to 35% year-over-year declines common from mid-2025 through May of this year. Still, construction remains low in absolute terms: it was the lowest August permit count since 2015, and the 20,970 permits issued from January through August are the lowest for that stretch since 2017.
| Slowing | Change | Growing | Change |
|---|---|---|---|
| Gilbert | −43% | Florence | +42% |
| Mesa | −36% | Apache Junction | +29% |
| Peoria | −31% | City of Maricopa | +25% |
| Surprise | −17% | Buckeye | +9% |
| Goodyear | −16% | ||
| Phoenix | −10% |
Maricopa County overall: down approximately 14.6% year to date.
Growth is holding up best farther from the urban core. Buckeye has now passed Surprise and trails only Phoenix among Maricopa County cities for single-family permits. That shift helps explain the negotiating conditions in the outer Valley: a homeowner selling there may be competing not just with other resales, but with builders offering brand-new homes, warranties, closing-cost help and subsidized financing.
Multi-family had an unusual August as well. Arizona permitted 2,169 multi-family units, the highest August total in records dating back to 1997, mostly from several large projects in Phoenix, Mesa, Scottsdale and Surprise. Multi-family permits tend to arrive in big batches, so one month isn't a trend, and year-to-date multi-family permitting is still about 11% below 2025.
The luxury market plays by different rules
The gap between luxury real estate and the broader Phoenix market is still wide. Overall August closings fell 6.3% from a year earlier, the first month in 2026 that sales failed to beat 2025. But the top of the market went the other way.
Mortgage rates simply carry less weight with this buyer. Cash purchases, larger down payments and greater financial flexibility make luxury buyers less sensitive to monthly financing costs. Equity markets, business performance and the broader economy tend to matter more.
That said, luxury isn't immune to supply and demand. September's pullbacks in Paradise Valley and Fountain Hills show that high-end sellers can still lose leverage when inventory outpaces buyers. Paradise Valley remains the strongest of the 18 primary markets despite its 22% monthly drop, and Scottsdale actually improved.
One more note: the volume of multimillion-dollar sales is now large enough to pull Valley-wide averages upward. When you see an "average sale price" headline, it may not reflect what's happening to the typical Phoenix home.
2026 STR investors: the clock is ticking
For short-term rental investors, the calendar has become a real factor. The return of 100% bonus depreciation sparked renewed interest this year in STRs as part of a broader real estate tax strategy. For qualifying property, especially when paired with a cost-segregation study, the potential benefit can be substantial. I break down how the structure works for high earners in the short-term rental tax loophole.
But buying the property is only step one. To benefit in 2026, the rental generally needs to be placed in service within the tax year, and that takes time:
- Renovations and repairs after closing
- Purchasing and installing furniture
- Upgrading landscaping, pools, game rooms and other amenities
- Professional photography, licensing, management systems and listings
Several tax professionals I work alongside are encouraging clients to make decisions well before December, since an inspection issue, contractor delay, furniture backorder or extended closing can quickly derail the timeline.
That makes established turnkey short-term rentals especially interesting right now. A property that's already furnished, photographed, managed and generating bookings can eliminate much of the setup time. You can see how that played out for one client in my turn-key Scottsdale 85254 STR case study.
That doesn't mean every existing vacation rental deserves a premium. Revenue history, expenses, location, condition, regulations, management costs, future reservations and the underlying real estate all still matter. The investment needs to make sense on its own, independent of the tax benefit. My Arizona short-term rental guide covers what separates a strong STR from a weak one.
Bonus depreciation, cost segregation, material participation and the treatment of rental losses should always be evaluated with a qualified CPA or tax professional based on your individual situation.
What this market means for buyers
September delivered a tougher financing environment but better negotiating conditions. Rates are higher than a few weeks ago, but demand is below normal, seller concessions are common, builders are offering aggressive incentives and many sellers are facing more competition. Buyers who can comfortably handle today's rates may find opportunities that weren't available when rates were lower and competition was fiercer.
- Negotiate the right thing. In some deals, a larger seller concession is worth more than an equivalent price reduction. In others, a builder's financing package may outweigh the advantages of a resale.
- Look closely at condition. A cheaper resale that needs a roof, HVAC system or windows in the next few years may end up costing more than a higher-priced home where those items are already done.
- Think in total cost. Factor in financing, concessions, HOA dues, property taxes, insurance, future capital expenses and included upgrades, not just the purchase price.
- Use the calendar. Q4 has historically favored Phoenix buyers. Sellers still listed through the holidays often become more motivated, and builders chasing year-end targets can get more aggressive.
Higher rates reduce purchasing power, but they can also temporarily reduce competition. Look at both sides rather than judging the market by the rate alone.
What this market means for sellers
September reinforces one lesson above all: know your competition before you list. Long-term tracking shows a clear pattern between how quickly a home goes under contract and how much of the original asking price the seller keeps.
Meanwhile, buyers have consistently negotiated around 97% to 97.5% of the final list price for nearly two years. That doesn't mean every seller should cut their price today, but it makes getting the initial positioning right more important than ever.
Your real competition depends on where you are. In some neighborhoods it's other resale homes. In growth areas, it may be a builder offering well-below-market financing. Luxury buyers now have considerably more inventory to choose from than they did in summer. October also tends to bring more listings, especially in luxury, retirement and seasonal communities, and median time to contract commonly stretches to about 50 to 60 days in the fourth quarter.
Look beyond comparable sales. Current competition, showing activity, pending contracts, builder incentives, concessions, condition and how buyers are responding to similar homes will give you a much clearer picture of where to position your property.
"The goal isn't to be the cheapest home on the market. It's to offer enough value relative to the alternatives that a buyer chooses yours."
The Phoenix housing market in Q4 2026
September gave us a much clearer picture than summer did. The key development isn't excess inventory, because there isn't any; supply is essentially normal at 100.3. The real story is demand at 77.2, which has pushed the overall Market Index down to 76.9. That's why buyers are gaining leverage even as prices hold steady.
Case-Shiller and the Market Index aren't contradicting each other. They're measuring different periods and different parts of the market. One reflects sales from months ago; the other shows today's balance of supply and demand.
Here's what I'll be watching most closely this fall:
- Seasonal demand: Will snowbird and seasonal buyers show up in enough numbers to absorb the inventory returning to the market?
- Builder incentives: October fiscal-year deadlines could bring some of the strongest new-construction deals of the year, adding pressure on resale sellers in growth areas.
- Mortgage rates: Whether rates stabilize will shape how quickly sidelined buyers return.
- STR timelines: There's still time for a 2026 acquisition, but far less room for delays.
Greater Phoenix enters the fourth quarter with relatively stable prices, historically normal supply, below-normal demand and major differences from one market to the next. That's a very different environment from both the inventory shortage of a few years ago and the correction that followed. For buyers, sellers and investors alike, Valley-wide statistics are a starting point, not an answer. Your specific property, neighborhood, financing, competition and timing will determine your outcome.
Phoenix housing market questions I hear most
Is Phoenix a buyer's or seller's market right now?
As of September 2026, Greater Phoenix overall favors buyers, with a Market Index of 76.9. Conditions vary widely by city: Paradise Valley, Scottsdale, Fountain Hills, Chandler and Cave Creek still favor sellers; Phoenix, Mesa, Avondale, Glendale and Gilbert are balanced; and Peoria, Tempe, Goodyear, Surprise, San Tan Valley, Buckeye, Queen Creek and Maricopa favor buyers.
Are Phoenix home prices going up or down?
According to the latest Case-Shiller data, Phoenix home prices rose 0.05% year over year, the first annual gain since May 2025, ending 13 straight months of declines. The gain is essentially flat and still negative after inflation, and prices remain about 4.9% below their June 2022 peak.
Why is the market favoring buyers if prices are stable?
Prices react more slowly than supply, demand and contract activity, and Case-Shiller lags by several months, so it mostly reflects sales from around mid-June. Today's buyer-favoring conditions come from below-normal demand, driven in part by a rapid rise in mortgage rates.
Is there too much inventory in Phoenix right now?
No. The Supply Index sits at 100.3, almost exactly the level of a balanced market. Inventory is rebuilding after summer as expected. The softness is on the demand side, where the Demand Index is 77.2.
Which Phoenix-area cities are strongest for sellers?
Among the 18 primary cities, Paradise Valley (164.4), Scottsdale (157.8) and Fountain Hills (152.2) lead, followed by Chandler and Cave Creek. Among smaller markets, Anthem (202.4), Sun City West (161.6) and Sun Lakes (159.9) remain strongly seller-favoring. Scottsdale was one of the few markets to improve in September, rising 3%.
Where do buyers have the most negotiating power?
Maricopa is the weakest major market for sellers at 46.2, followed by Buckeye and Queen Creek at 51.1, Surprise at 67.3 and Tempe at 74.8. These areas also face more competition from builders offering incentives, which gives buyers additional leverage.
How are mortgage rates affecting the Phoenix market?
Freddie Mac's 30-year fixed average rose from 6.76% on September 10 to 7.03% on September 24, 2026. The speed of the increase is what disrupts demand: some buyers have to adjust their price range and others pause their search until rates settle. A one-point rate change can move a principal-and-interest payment by roughly 10%.
Are Phoenix sellers paying buyer concessions?
Yes. In August, 59% of Greater Phoenix MLS sales included a seller-paid incentive, with a median contribution slightly above $10,000. In the $350,000 to $400,000 range, about 71% of sales included seller assistance, often used for closing costs or rate buydowns.
Is new construction a better deal than resale right now?
It can be. Several builders have October fiscal-year deadlines and are offering price reductions, closing-cost help and below-market financing that can produce a lower monthly payment than a cheaper resale. Resale homes often include landscaping, window coverings, appliances or a pool, so compare the total cost of ownership rather than price alone.
How is the Phoenix luxury market performing?
Luxury continues to outperform. While overall August closings fell 6.3% from a year earlier, sales above $1.5 million rose about 15%, and sales above $3 million jumped roughly 59%, from 39 to 62 homes. Luxury buyers are less sensitive to mortgage rates, though Paradise Valley and Fountain Hills both softened in September.
Is fall a good time to buy a home in Phoenix?
Historically, the fourth quarter has favored Phoenix buyers. Sellers still on the market through the holidays tend to become more motivated, and builders chasing year-end targets often increase incentives. This year, returning snowbird buyers could absorb some inventory, so the window may be strongest in October and November.
How long does it take to sell a home in Phoenix in the fall?
Median time to contract in Greater Phoenix commonly reaches about 50 to 60 days in the fourth quarter. Homes that go under contract within about 15 days tend to sell near 99% of their original asking price, compared with about 95% at one to two months and 90% at three to four months.
Market data, read by a former wealth manager
I'm Eric Ravenscroft, founder of The Ravenscroft Group at Real Broker, a Top 1% REALTOR® across North America and Top 100 in the Greater Phoenix Metro. I hold the CRS designation, the highest credential in residential real estate, alongside GRI, ABR, MRP, SRES® and RSPS.
Before real estate, I served as a Director of Wealth Management, advising physicians, executives and business owners on tax planning, portfolio strategy and long-term wealth building. That background shapes how I read a market like this one. I don't stop at the headline number. I look at what's driving it, how long it's likely to last, and what it means for the specific decision in front of you, whether that's pricing a listing, negotiating a builder incentive, or structuring an investment property around your tax picture.
It's also why I write these monthly updates the way I do. Valley-wide statistics are useful, but they rarely answer the question clients actually ask: what should I do? The answer depends on your neighborhood, your price point, your financing and your timeline, and that's the conversation I'd rather have with you directly.
From buyers, sellers and investors across the Phoenix metro. Read them on Google →
I'm a preferred real estate partner for USAA, Chase, SoFi, PennyMac, Citibank, Citizens, Huntington and Fifth Third, and my work has been featured in The Wall Street Journal, MarketWatch, Morningstar and MSN Money. You can read more about my background, browse recent client wins, or see how I approach real estate as part of a broader financial plan.
"Most agents can tell you about a neighborhood. Very few can tell you what a property will do to your balance sheet. I built my practice around closing that gap."
Want these updates in your inbox each month? Sign up for my newsletters and guidance. No charge, no obligation to work together.
Make your Q4 move with the full picture
Valley-wide numbers are only a starting point. In a 20-minute call, I'll translate this month's data into a clear strategy for your property, your neighborhood and your timeline.
Keep exploring
More resources for Phoenix buyers, sellers and investors.
Categories
- All Blogs (324)
- Active Adult & 55 Plus Communities (17)
- Arizona Relocation Guides (31)
- Buyers (214)
- Financial Planning (61)
- General Real Estate (141)
- Income From Real Estate (60)
- Market Update (26)
- New Construction (29)
- News, Updates and Coming Soon (57)
- Real Estate Agent Financial Planning (22)
- Real Estate Investing (96)
- Sellers (107)
- Vacation and Short Term Rentals (45)
Recent Posts






About the Author
Eric Ravenscroft is a Top 1% REALTOR® across North America and one of Arizona’s most trusted real estate strategists. With 15 years of experience spanning real estate, wealth management, and investment planning, he helps clients make smarter, financially grounded decisions, from new construction and relocations to STR investments, 1031 exchanges, and long-term portfolio strategy.
Eric’s expertise has earned him industry recognition, Elite status with Real Broker, and features in major publications including the Wall Street Journal, MarketWatch, MSN, and Morningstar. Clients across the Greater Phoenix Metro rely on his clarity, strategic insight, and results-driven guidance.
Ready to make a confident real estate move? Call or text Eric today.