
Is Solar Worth It in Arizona? The Complete Financial & Long-Term Investment Guide
Is Solar Worth It in Arizona? The Complete Financial & Long-Term Investment Guide
Arizona has more sunshine than almost anywhere else in the country. It does not automatically follow that solar panels are a good investment for every homeowner. Here is the real math on cost, financing, utility rates, and resale — the numbers most solar quotes never walk you through.

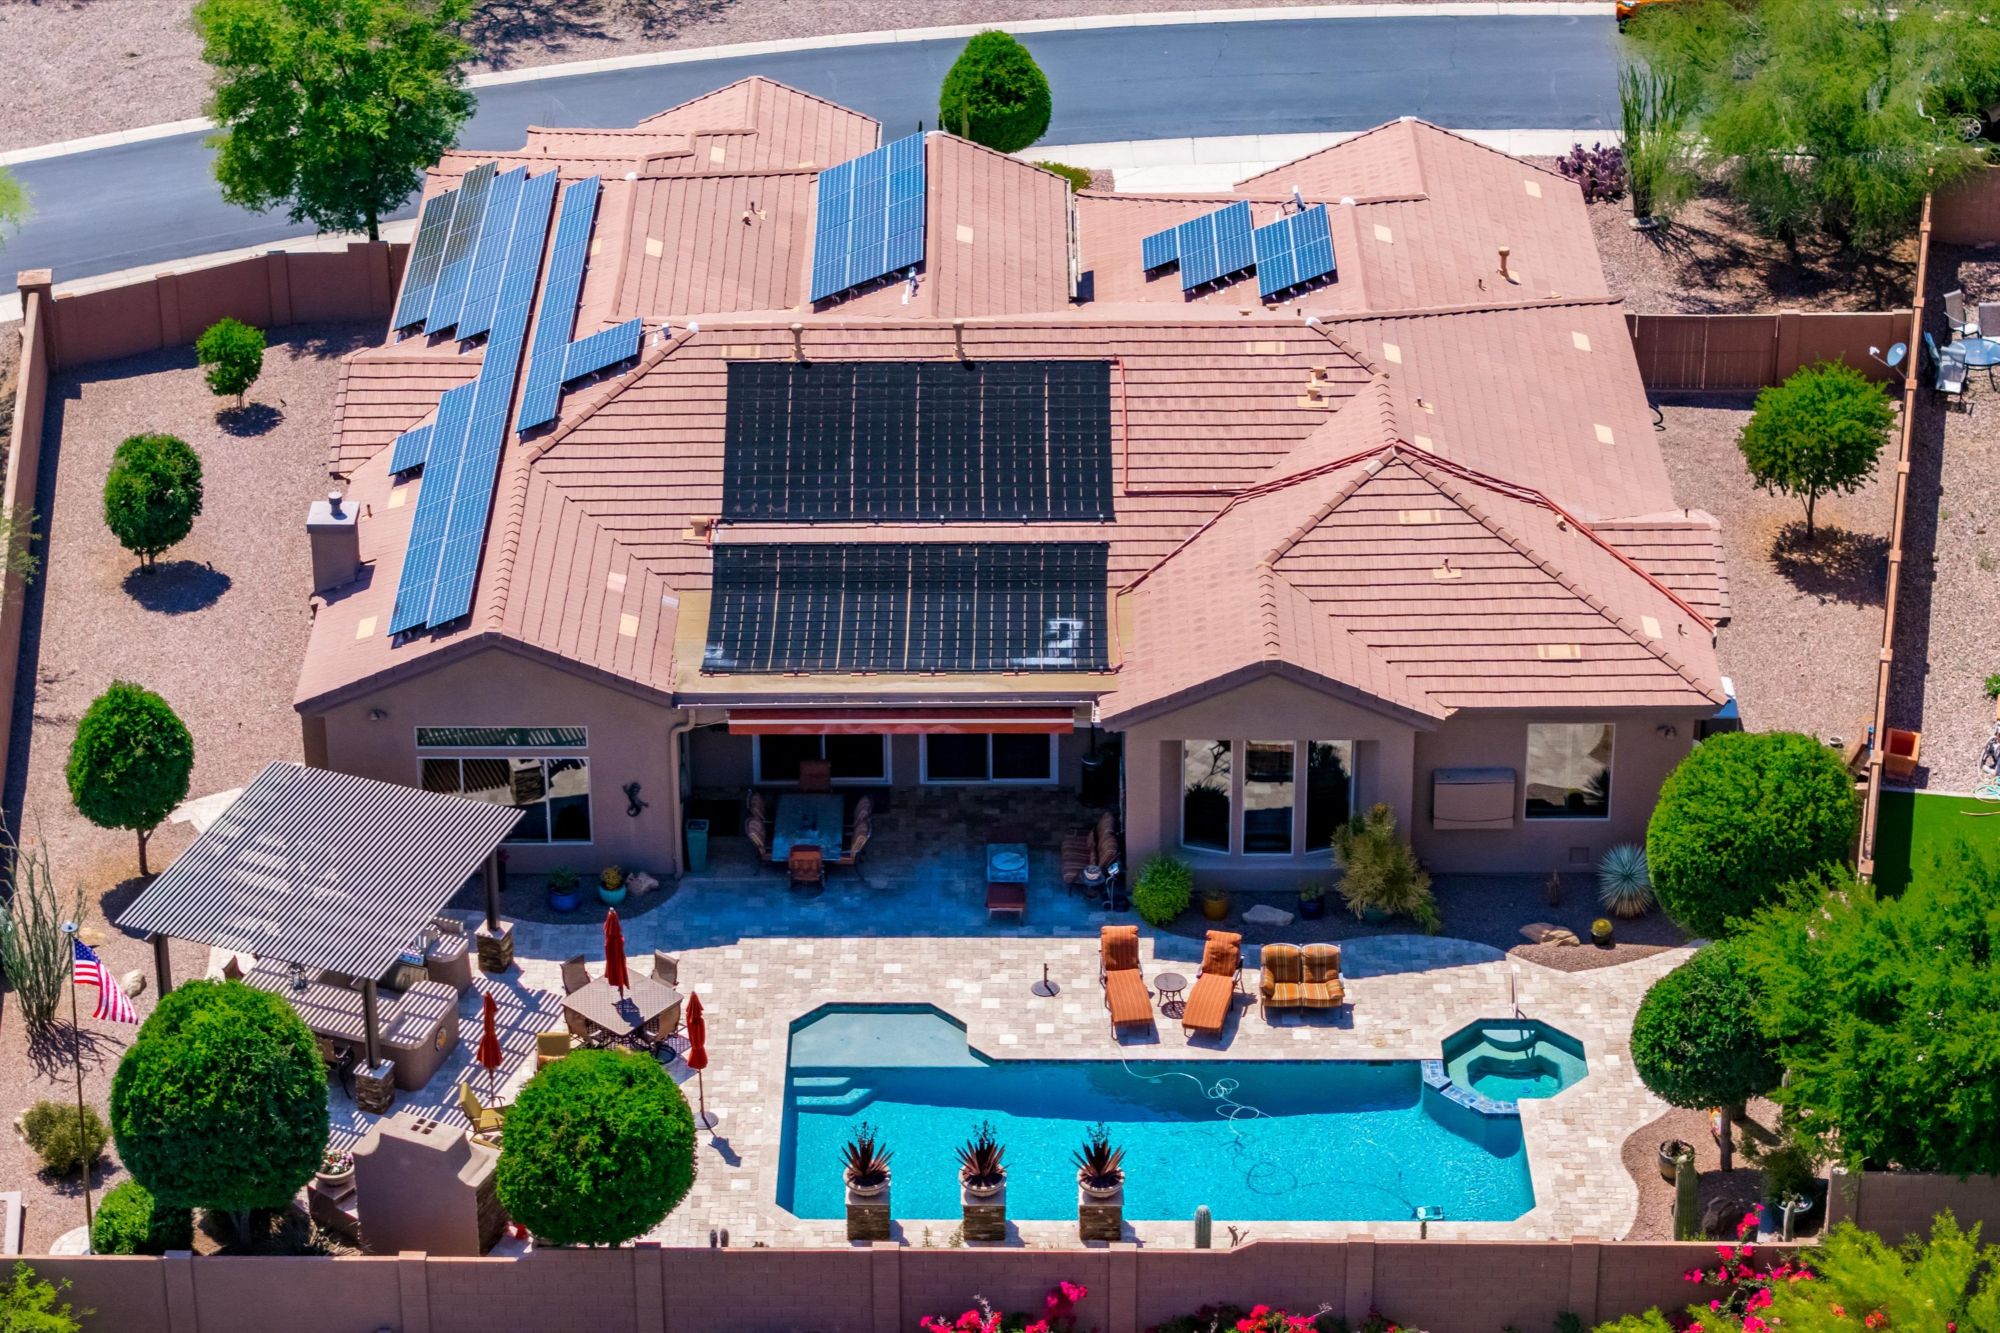
In a state with over 300 sunny days a year, installing solar panels can feel like an obvious decision. But solar is not a weather question — it's a capital allocation question. For most Arizona homeowners, it's one of the largest financial commitments they'll make outside their mortgage. The math depends on your utility's export rate, your financing terms, how much of your own production you actually use, and — because this is ultimately a real estate decision as much as an energy one — your home's eventual buyer.
This guide walks through that calculation in full: current costs, how Arizona's utilities actually pay for exported power, how cash, loan, and lease options really compare over 25 years, the opportunity cost of your capital, and the resale realities most solar quotes never mention.
What Changed in 2026
For years, Arizona homeowners could sell excess solar power back to the grid at close to the same rate they paid to buy it. That era is over. Arizona utilities transitioned from full retail-rate net metering to net billing back in 2017, and the gap between what you pay for grid power and what you're credited for exported power has continued to widen since.
SRP retired its traditional net metering plans in November 2025, moving all new solar customers onto time-of-use net billing with a flat monthly grid-access charge. APS's export rate resets annually under its Resource Comparison Proxy structure, with the Arizona Corporation Commission capping any single-year decline at 10%. In practice, this means the export side of your solar math gets a little less favorable most years — not more.
The practical upshot: a payback estimate you saw a few years ago, or from an installer modeling full retail-rate net metering, is very likely overstating what a new system exporting power in 2026 will actually earn back. The system that makes financial sense today is sized around using your own power, not selling it.
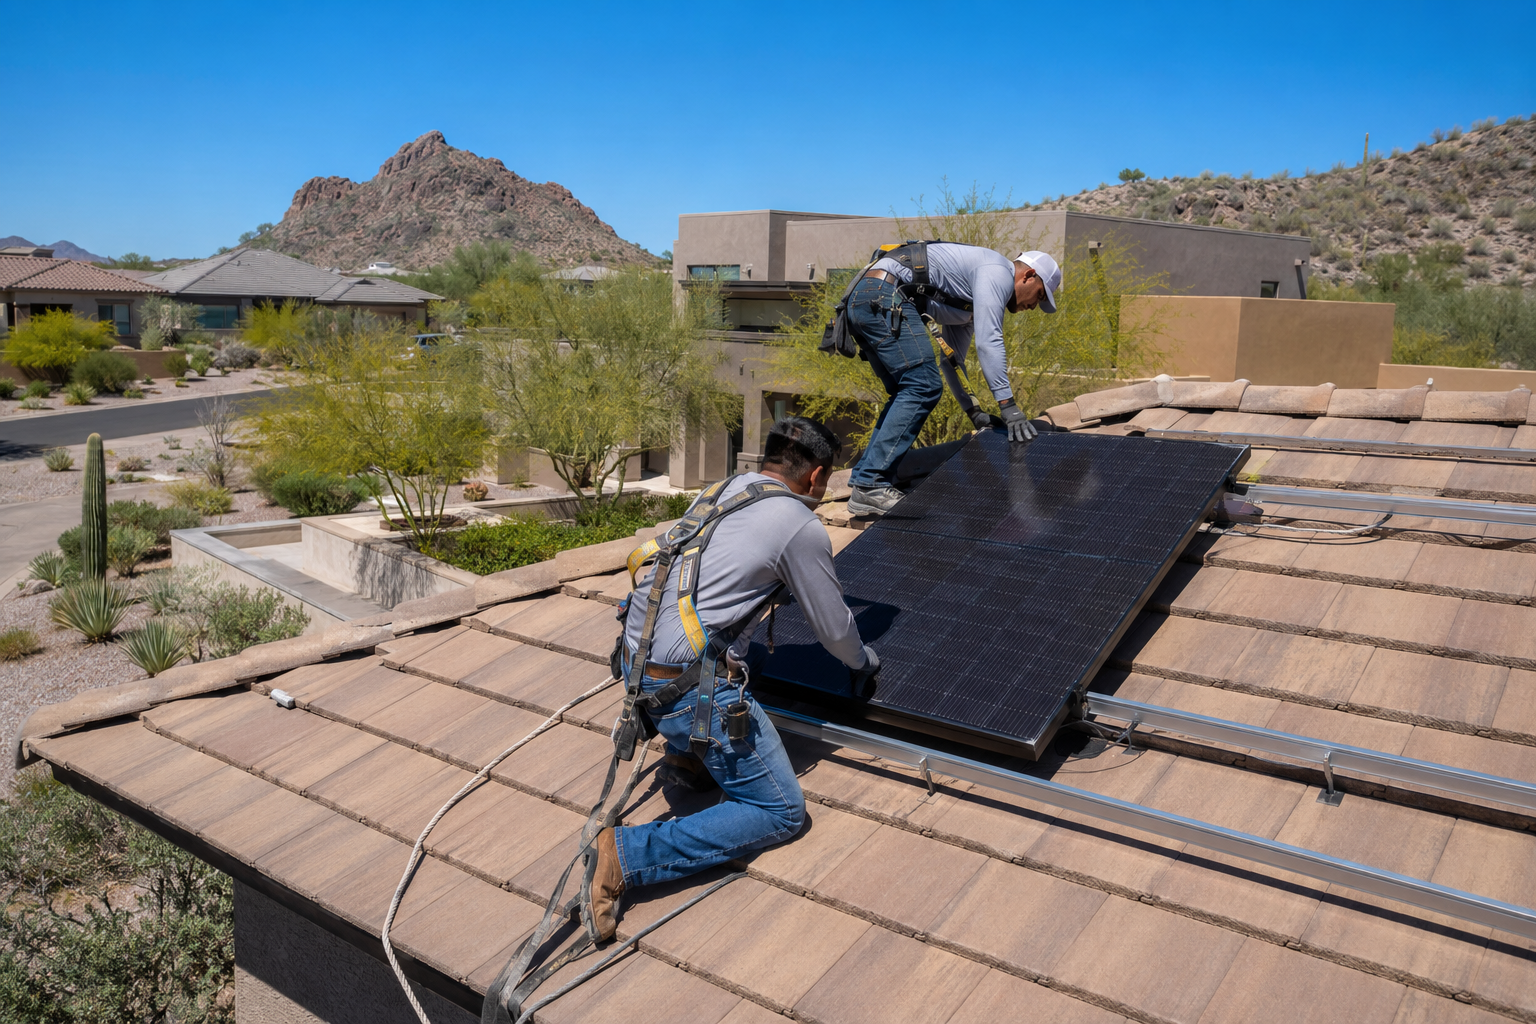
What Solar Actually Costs in Arizona Right Now
Arizona homeowners use meaningfully more electricity than the national average — roughly 1,100+ kWh per month versus about 880 kWh nationally, driven almost entirely by air conditioning load from May through September. That means Arizona systems tend to run larger than the national norm, which affects the total price even though the state's cost per watt is competitive.
| System size | Est. gross cost* | Typical household fit |
|---|---|---|
| 5 kW | $11,000–$15,000 | Small home, low usage, partial offset |
| 8–10 kW | $18,000–$23,000 | Average-size home, moderate AC load |
| 13.6 kW (AZ average) | ~$31,000 | Typical single-family home, full offset target |
| 14.5 kW (Phoenix average) | ~$33,000 | Larger home / pool / heavy summer AC use |
*Gross cost before any incentives, based on 2026 statewide and Phoenix-metro averages of roughly $2.28–$2.29 per watt installed. Your installer's quote is the number that matters — use this table to sanity-check it, not replace it.
Get at least three quotes at the cost-per-watt level, not just a bottom-line number, so you can compare apples to apples across equipment tiers and installers. If you're weighing solar as part of a new build rather than a retrofit, our Arizona new construction guide covers how solar-readiness, roof specs, and builder incentives vary by community.
What Arizona Actually Offsets Today
Two state-level exemptions apply automatically to most residential solar installations, and they're worth knowing about even though neither moves the needle as much as the utility rate structure does. If you're evaluating solar alongside other tax-motivated moves — a 1031 exchange, bonus depreciation on a rental, or cost segregation — that's exactly the territory our real estate tax strategy guide is built for.
| Provision | What it's worth | Notes |
|---|---|---|
| Property tax exemption | Added system value excluded | Solar doesn't increase your assessed value for property tax purposes |
| Sales tax exemption | Equipment exempt | Applies to qualifying solar equipment purchases |
Net Billing: The Part Most Pitches Gloss Over
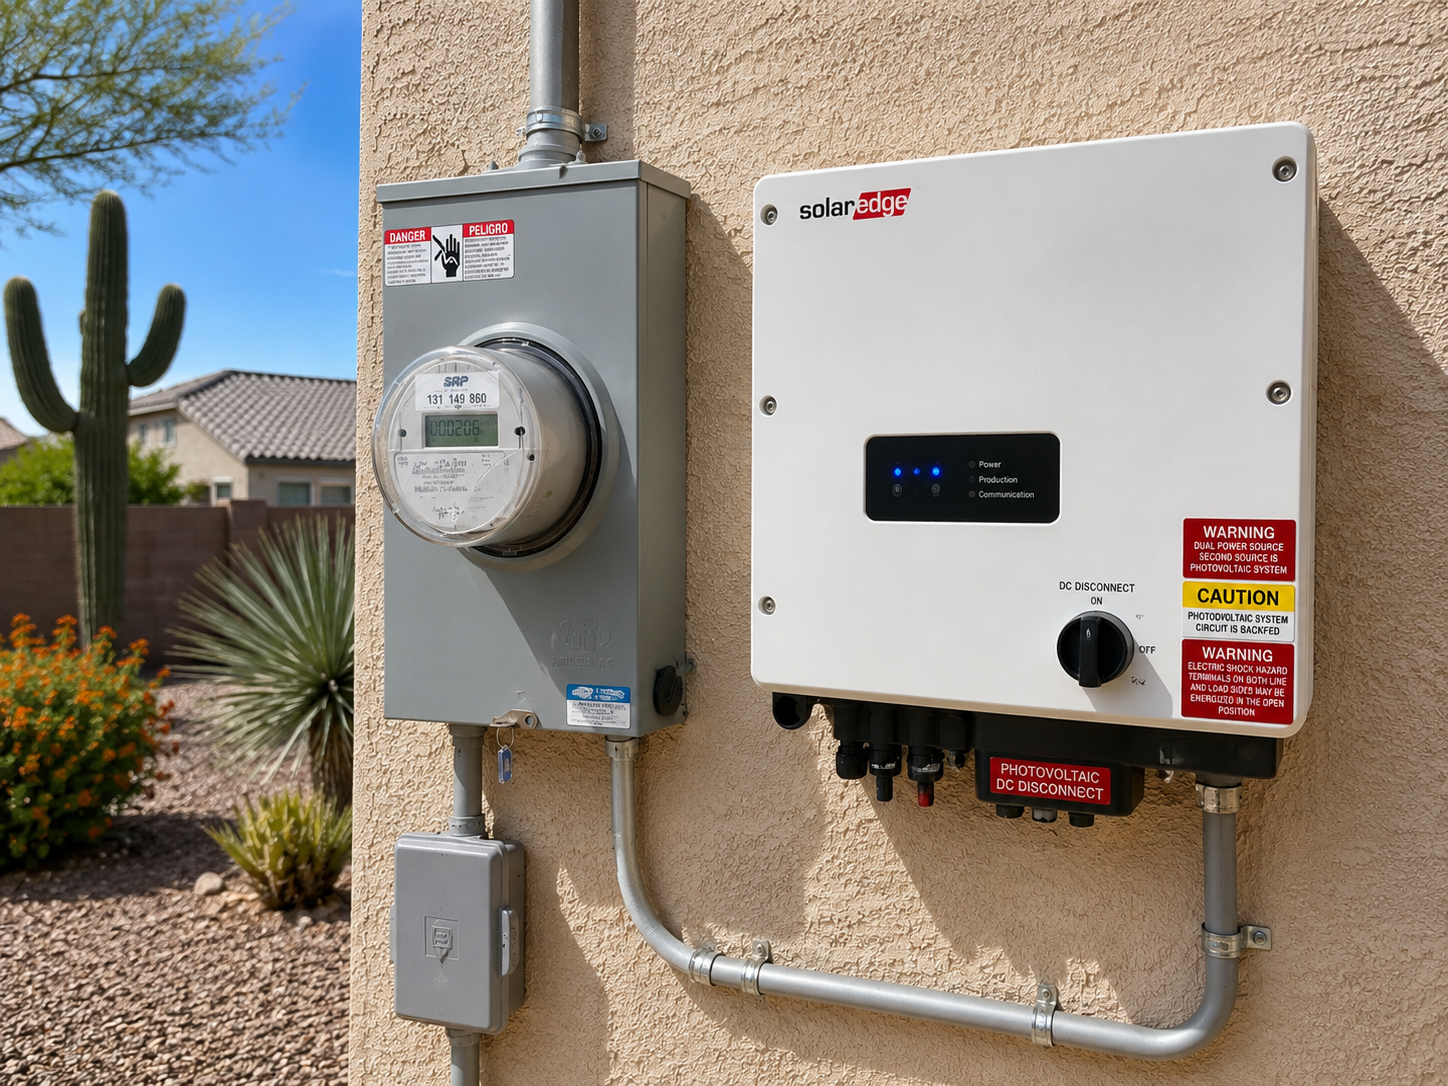
Arizona moved away from full retail-rate net metering back in 2017. Today, all three major utilities operate under net billing: the power you use as you generate it offsets your bill at the full retail rate, but any excess you export to the grid is credited at a much lower rate.
| Utility | Export credit | Retail rate | Structure |
|---|---|---|---|
| APS | ~$0.03–$0.06/kWh | ~$0.13–$0.15/kWh | Resource Comparison Proxy (RCP); rate resets annually, capped at a 10% year-over-year decline |
| SRP | ~$0.037–$0.063/kWh | ~$0.13–$0.15/kWh | Time-of-use net billing plus a flat monthly grid-access charge (~$32/mo); traditional net metering retired Nov. 2025 |
| TEP | ~$0.057/kWh | ~$0.15/kWh | Net metering phased out in 2018 for new customers |
Because export credits sit at roughly 25–45% of the retail rate, oversizing your system to sell power back is a losing strategy in Arizona. The financial case now depends on self-consumption — running your AC, EV charger, and pool pump while the sun is out, or shifting that load with a battery — not on the export credit. Right-sizing to your actual usage matters more here than in states that still offer full retail net metering.
Three Ways to Pay — and What Each Really Costs
How you finance a system changes its economics more than almost any other variable. Here's the honest comparison over a 13.6 kW, ~$31,000 system.
| Path | Ownership | Upfront cash | Resale position |
|---|---|---|---|
| Cash purchase | You own it outright | Full system cost | Cleanest; system is a home asset, though often under-credited by appraisers |
| Solar loan (10–20 yr) | You own it once paid off | $0–$3,000 down, typically | Loan balance must be paid off or assumed at sale — a real negotiating friction point |
| Lease / PPA (TPO) | Financier owns it | $0 down, typically | Buyer must qualify to assume the agreement, or seller pays it off — the scenario agents flag most often |
Financed purchases deserve a closer look, because the monthly numbers are what get pitched at the kitchen table. On roughly $31,000 borrowed at prevailing solar-loan rates over 15–20 years, monthly payments commonly land in the $250–$320 range. Compare that against realistic monthly savings — not the sales projection — before signing anything. Our calculators page is a useful place to model your own payment and affordability numbers before you sit down with an installer.
If your solar loan payment is close to or higher than your average monthly savings, you haven't bought free electricity — you've swapped one bill for another, and taken on a 15–20 year liability tied to your house.
The Opportunity-Cost Math
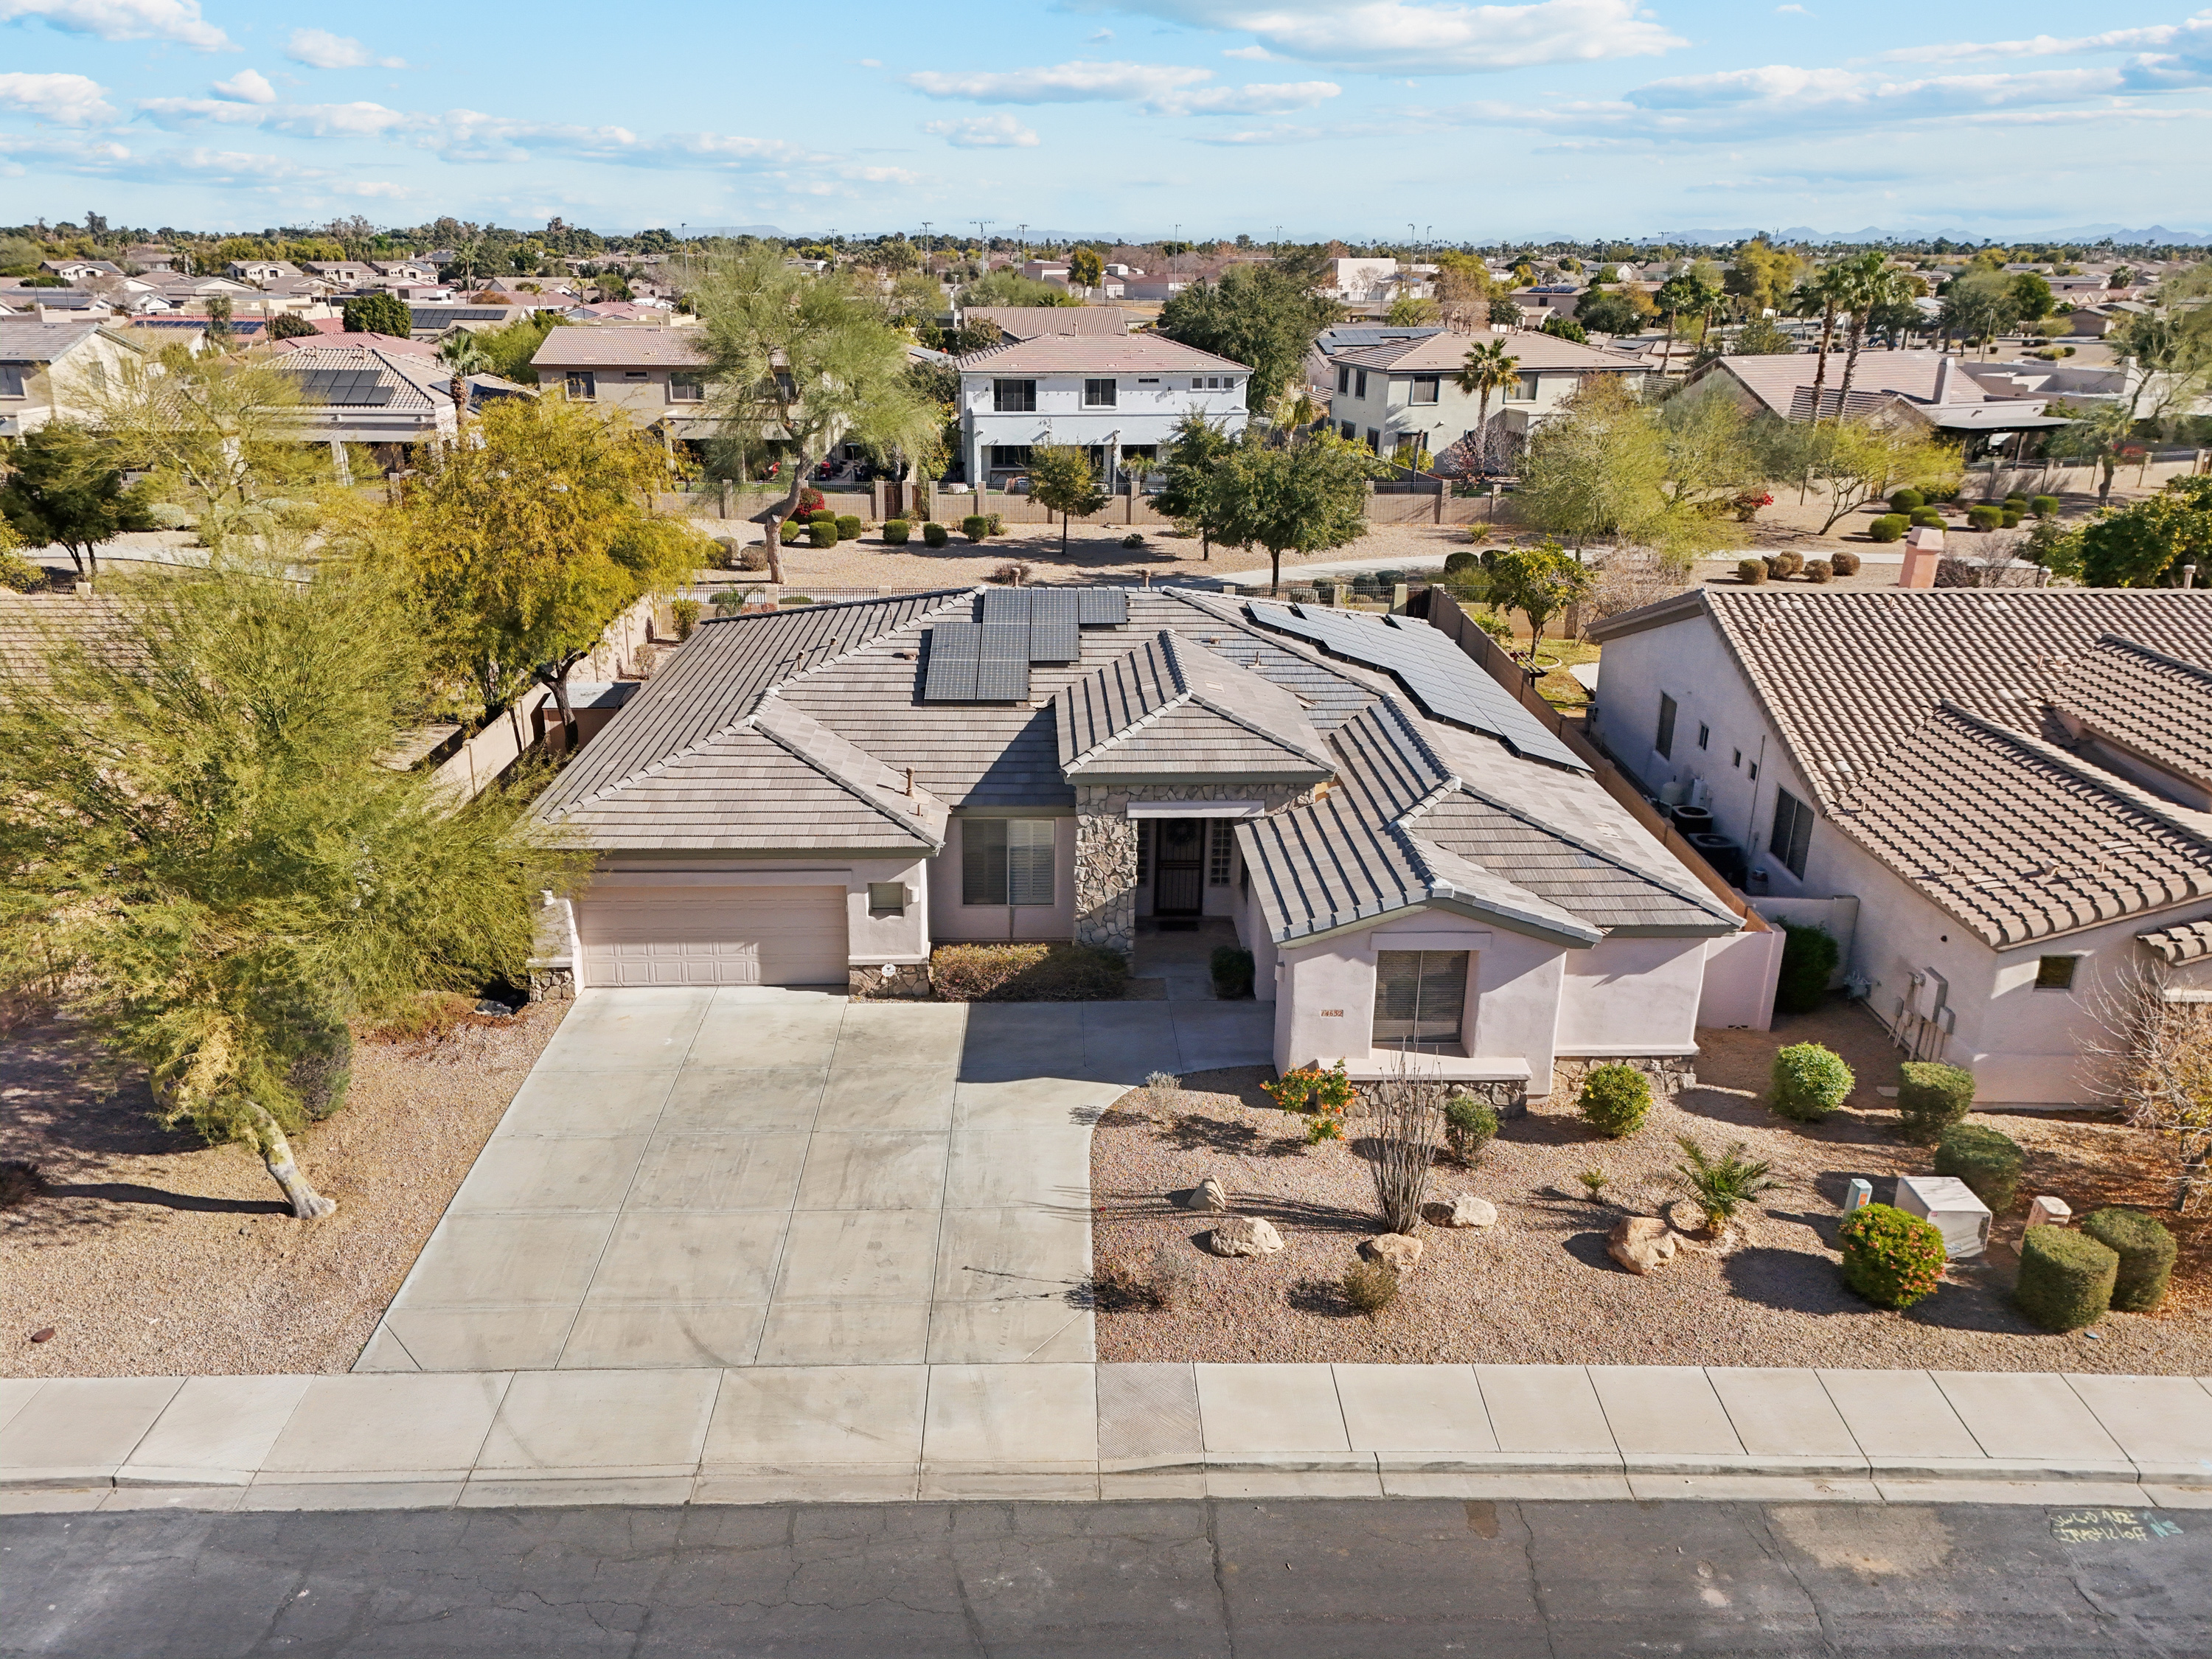
This is the question most solar conversations skip entirely: what else could that capital do? If you paid roughly $31,000 cash for a system today, the honest comparison isn't "solar vs. nothing" — it's "solar vs. that same $31,000 invested elsewhere."
Illustrative model: $31,000 compounding at 7% annually reaches roughly $168,000 by year 25. The same $31,000 spent on solar, generating an estimated $2,300–$2,600 per year in realized savings after net-billing haircuts and fixed grid charges, produces roughly $58,000–$65,000 in nominal savings over the same 25 years — before accounting for any residual value the panels may (or may not) add at resale. This is a simplified model for illustration, not a projection for any specific home.
None of this means solar is a bad decision by definition — it means the comparison is opportunity cost vs. avoided cost, and both sides deserve honest numbers. The lower your realized savings (because of net billing haircuts, fixed grid charges, or a financed purchase), the higher the bar solar has to clear to beat simply investing the same capital. If you want to weigh this decision against your broader portfolio rather than in isolation, that's the kind of question our personal financial planning practice is built around. The next section walks through exactly how that bar changes depending on how you pay.
Worked Examples: Cash, Loan, and Lease Side by Side
Numbers land differently depending on how you pay for the same system. Below are three simplified models of a 13.6 kW Arizona system (~$31,000 installed) generating an estimated $2,400 per year in realized savings — the figure used throughout this guide, based on self-consumption plus a modest net-billing export credit.
All three examples use the same system size, the same $2,400/year estimated savings, and a 7% comparison return for opportunity-cost figures. Loan and lease terms and rates vary meaningfully by lender and installer — treat the figures below as an illustration of how the structure changes the math, not a quote for your home.
Example 1 — Cash Purchase
| Upfront cost | $31,000 |
| Monthly payment | $0 |
| Estimated annual savings | ~$2,400 |
| Simple break-even | ~13 years |
| Opportunity cost of $31,000 at 7%, by break-even | ~$74,700 |
| Cumulative savings by year 25 | ~$60,000 |
| Opportunity cost of $31,000 at 7%, by year 25 | ~$168,000 |
The cash path is the cleanest to model: you own the asset immediately, capture the full state exemptions, and every dollar of realized savings is yours. It's also the path where the opportunity-cost gap is most visible — by year 25, the same $31,000 left in the market has grown to roughly triple what the system saved you, even before accounting for the fact that panel output typically degrades gradually over 25 years while the invested capital keeps compounding.
Example 2 — Solar Loan (15-year term, ~8% APR, $0 down)
| Upfront cost | $0 down |
| Monthly payment | ~$296 |
| Estimated annual savings | ~$2,400 (~$200/mo) |
| Net monthly cash flow while loan is active | ≈ –$96/mo |
| Total paid over 15-year term | ~$53,300 |
| Break-even (cumulative savings catch up to cumulative payments) | ~year 22 |
| Net financial benefit by year 25 (savings minus total paid) | ~$6,700 |
This is the scenario the "$0 down, save money from day one" pitch describes least accurately. At a typical solar-loan rate, the monthly payment often runs higher than the monthly savings the system generates under Arizona net billing — meaning your out-of-pocket cost increases for as long as the loan is active. You still end up owning the system once it's paid off, but the interest cost meaningfully delays break-even and shrinks the 25-year net benefit compared to paying cash. If you're comparing a solar loan to your own investment alternative, ask what that same monthly payment would do compounding in the market instead — invested at 7% for 15 years, $296/month would grow to roughly $93,800.
Example 3 — Lease / PPA (20-year term, $0 down, ~$140/mo starting, ~2.9% annual escalator)
| Upfront cost | $0 down |
| Monthly payment (starting) | ~$140, rising ~2.9%/yr |
| Estimated avoided utility cost | ~$2,400/yr, rising with utility rates |
| Net monthly savings (starting) | ~$60/mo |
| Total paid over 20-year term | ~$45,000 |
| Net financial benefit over 20 years | ~$15,000–$20,000 |
| Equity or ownership at year 20 | None |
A lease or PPA typically produces the smallest net financial benefit of the three paths, because the financing company — not you — owns the system and prices the agreement to cover its own return. The appeal is the $0 upfront cost and a monthly payment that's usually lower than a comparable loan payment. The trade-off is that you're building no equity: after 20 years of payments, you own nothing, and as covered next, you've also taken on the most resale friction of the three options.
| At a glance | Cash | Loan | Lease / PPA |
|---|---|---|---|
| Upfront cost | $31,000 | $0 | $0 |
| Who owns the system | You | You, once paid off | The financing company |
| Approx. net benefit, 20–25 yrs | ~$29,000 | ~$6,700 | ~$15,000–$20,000 |
| Resale friction | Low | Moderate | High |
Illustrative figures based on the shared assumptions above; actual loan rates, lease terms, escalators, and installer pricing vary and will change every number in these tables. Use this as a framework for comparing quotes, not as a substitute for them.
The Real Estate Lens: What Happens When You Sell
Most solar content stops at the utility bill. As a REALTOR® who has represented both buyers and sellers of solar homes across the Valley, this is the section I think matters most — because for most people, a home purchase decision doesn't last 25 years. The average homeowner moves well before a system fully pays for itself, and how you paid for the system changes what happens at your closing table. Current buyer demand and days-on-market trends also shift what "resale friction" actually costs you — our Phoenix housing market updates track those conditions month to month.
Roof Warranty Risk
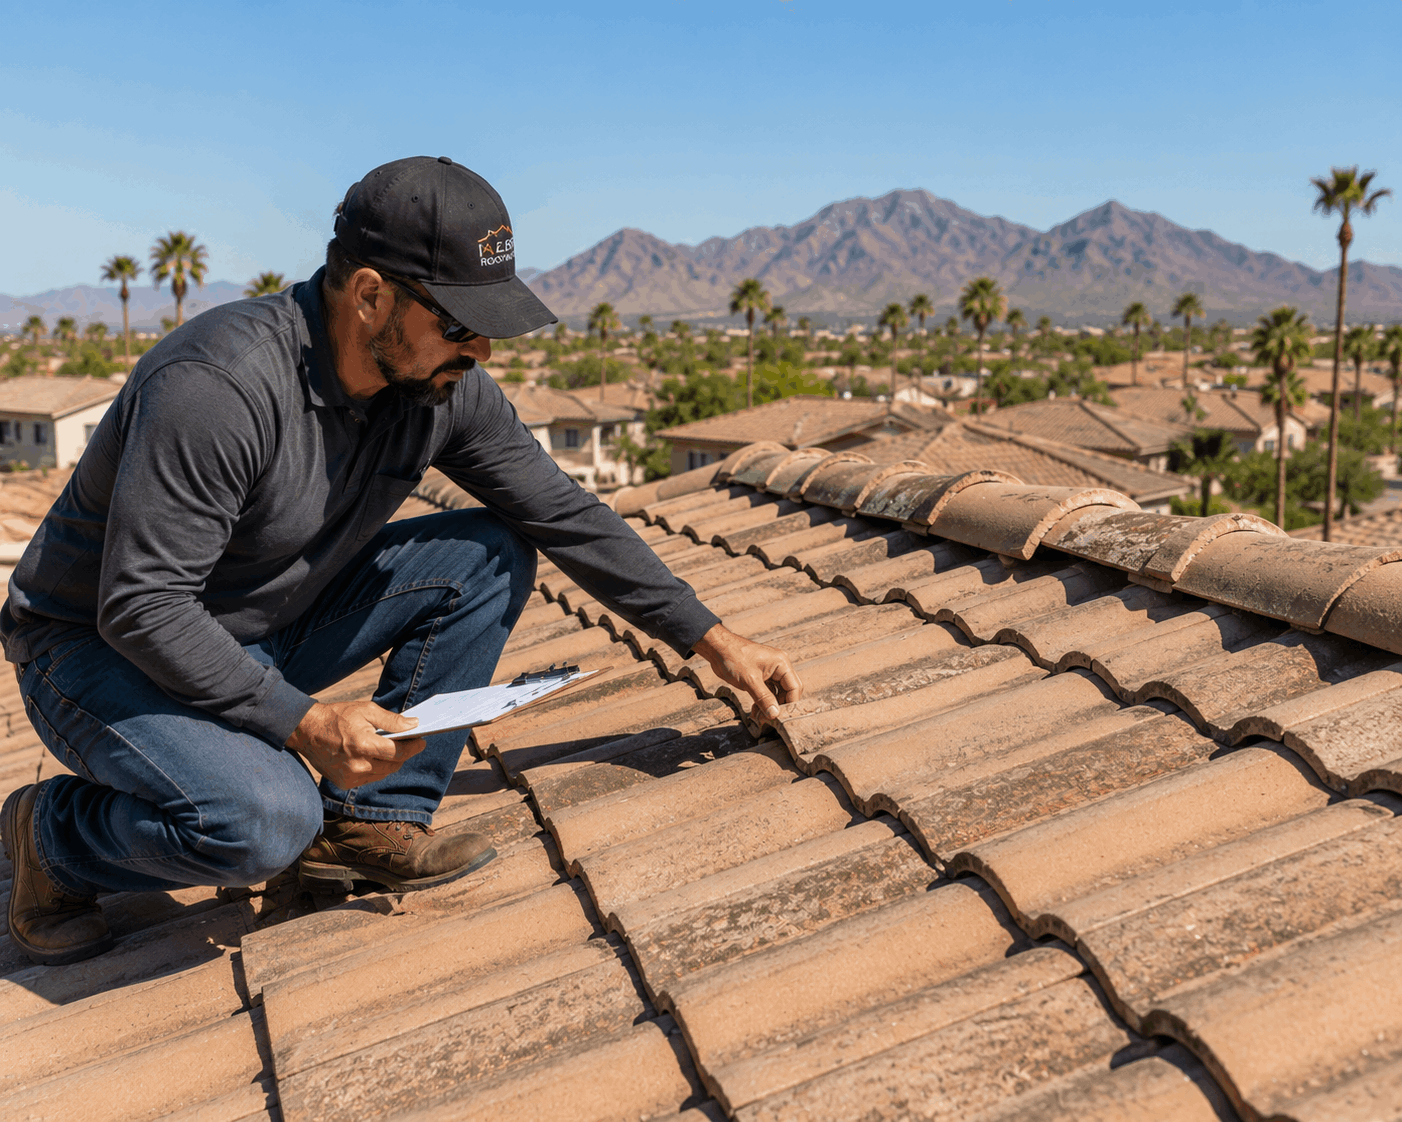
Installing panels can void your existing roof warranty unless your solar installer formally assumes that liability in writing. This matters more in Arizona than in milder climates: an estimated 40% of Arizona residential roofs are already 15 years or older, and panels add roughly 3–5 pounds per square foot of additional load. Treat a solar project as a roof-and-energy project together — get the roof inspected first, not after.
How Each Payment Path Plays Out at Resale — and Why
Every resale scenario ultimately comes down to the same three questions: does the appraiser have reliable data to credit the system, does the buyer's lender see an encumbrance attached to the property, and does the buyer have confidence they're not inheriting an obligation they don't fully understand. How you paid for the system determines the answer to all three.
Owned outright (cash, or a paid-off loan)
- Cleanest position: the system is simply part of the home, with no lien or contract to resolve
- Still often under-credited by appraisers, because Arizona has too few solar-specific comparable sales for most appraisers to model added value reliably
- Buyers are more receptive when you can hand over production history and equipment documentation, since it removes their biggest unknown
Still financing a loan
- Most solar loans are not assumable, so in practice the balance is paid off from sale proceeds at closing — reducing your net proceeds by the payoff amount regardless of what the appraiser credits the system
- If the appraisal doesn't fully offset the remaining balance, that gap comes directly out of your equity
- Some solar loans are secured by a UCC fixture filing against the system itself, which needs to be released at closing — an extra step your title company will flag
This is the scenario agents flag most often. Because the financing company — not you — owns the equipment, your buyer must either qualify to assume the remaining lease or PPA (a credit approval process similar to financing, which some buyers can't or won't complete) or you must buy out the agreement before or at closing, which can cost several thousand dollars depending on the remaining term. Lenders underwriting your buyer's mortgage will also factor the lease payment into that buyer's debt-to-income calculation, and some conventional, FHA, or VA underwriters scrutinize a recorded lease or UCC filing on the property as a title matter. In practice, this combination — a required buyer credit approval, a potential payoff cost, and lender scrutiny — is why leased and financed solar homes see a narrower buyer pool and, on average, more days on market than comparable homes without an outstanding solar obligation.
We've navigated all three of these scenarios with real sellers across the Valley — you can see how similar financial and resale decisions played out in our client case studies.
When Solar Makes Sense — And When It Doesn't
Solar tends to make sense when you...
- Pay cash, or finance at a rate close to your expected investment return
- Plan to stay in the home 15+ years
- Have consistently high summer usage (large home, pool, EV)
- Size the system to your own consumption, not to maximize exports
- Get the roof inspected and, if needed, replaced first
Reconsider or wait if you...
- Plan to sell within 5–10 years
- Are relying on a lease or PPA to "save money with no upfront cost"
- Would need to finance at a rate well above what you could otherwise earn on that capital
- Have a roof nearing the end of its service life
- Have only received one quote, or a quote that models full retail-rate net metering instead of your utility's actual export rate
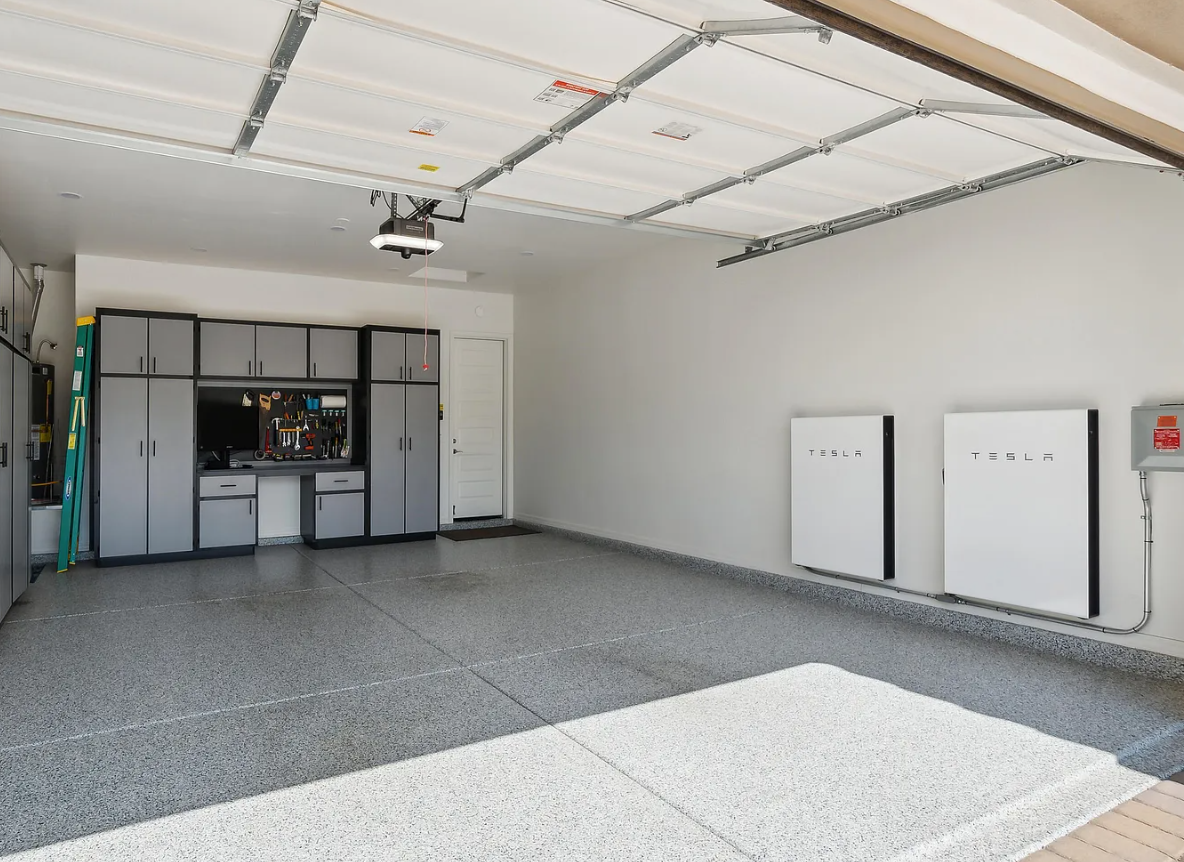
Battery storage is the one variable that can shift a home from the "reconsider" column toward the "makes sense" column, since it lets you shift self-consumption into the evening instead of exporting at the lower net-billing rate — at the cost of $12,000–$22,000 added upfront.
Before You Sign: A Decision Checklist
- Get the roof assessed first. If it's within 5–7 years of needing replacement, factor that cost in before, not after, installation.
- Get three quotes, priced per watt. Compare equipment tiers and installers on equal footing rather than bottom-line price alone.
- Model self-consumption, not export. Ask your installer to show you production vs. your actual hourly usage, not just annual totals.
- Check assumability. If financing, ask in writing what happens to the loan or lease if you sell in year 5, 10, or 15.
- Request appraisal-ready documentation. Ownership status, equipment specs, and production history help — but don't assume they'll fully offset the cost at resale.
- Confirm your utility's current export rate and any fixed grid-access fees directly with APS, SRP, or TEP before finalizing your system size.
- Talk to a real estate advisor before you sign — especially if there's any chance you sell within the next decade.
Frequently Asked Questions
How much does a solar system cost in Arizona in 2026?
The average Arizona system runs about 13.6 kW and costs roughly $31,000 installed, based on a 2026 statewide average of about $2.28–$2.29 per watt. Phoenix-metro systems average slightly larger, around 14.5 kW, at roughly $33,000. Actual pricing depends on your home's usage, roof, and the installer and equipment tier you choose.
Does Arizona still offer any solar-related tax exemptions?
Yes. Arizona exempts qualifying solar equipment from state sales tax and excludes the added system value from your home's assessed property value, so installing solar does not raise your property tax bill. Confirm current eligibility with a licensed tax professional before you rely on either exemption.
Do solar panels increase home value in Arizona?
Owned, paid-off systems can add some value, but Arizona appraisers frequently under-credit or ignore solar in comparable-sales appraisals. Financed or leased systems are typically treated as neutral to negative, since the buyer must qualify to assume the obligation or the seller must pay it off.
What happens to my solar loan or lease when I sell my house?
Financed systems are typically paid off from sale proceeds or negotiated into the price. Leased or PPA systems require the buyer to qualify to assume the agreement, or the seller pays it off before closing — either can narrow your buyer pool and add time on market.
Is solar still worth it in Arizona in 2026?
It depends on how you pay, how long you'll stay, and how much power you self-consume. Cash buyers staying 15+ years with high self-consumption (often paired with a battery) still see reasonable paybacks. Financed purchases and short ownership horizons are where the math is most likely to underperform simply investing the same capital.
How does net billing affect my solar savings with APS or SRP?
Arizona moved from net metering to net billing in 2017. Power you export to the grid is credited at roughly $0.03–$0.06/kWh versus a retail rate near $0.13–$0.15/kWh. That gap means most of your savings now come from using power as you generate it, not from selling it back.
What's the difference between a solar loan, a lease, and a PPA?
With a loan, you own the system from day one and make fixed payments until it's paid off. With a lease, a financing company owns the system and you pay a fixed monthly fee to use its output, with no ownership at the end unless you buy it out. With a power purchase agreement (PPA), instead of a flat fee you pay a set rate per kWh the system actually produces — your payment varies with production and sunlight, but ownership still sits with the financing company. Both leases and PPAs typically escalate a set percentage each year.
Does solar keep working during a power outage?
No — not without a battery. Standard grid-tied solar systems automatically shut off during a utility outage as a safety measure (to protect line workers from "backfeeding" power onto the grid). To keep power flowing to your home during an outage, you need a battery system with backup capability, which is a separate cost on top of the panels themselves.
Do I need a battery to make solar worth it in Arizona?
Not strictly, but batteries are becoming more relevant under net billing. Since export credits are worth roughly a third of the retail rate, storing your excess daytime production to use during evening peak hours — instead of exporting it for a low credit — can meaningfully improve your savings, especially on time-of-use rate plans. Batteries typically add $12,000–$22,000 to a system's cost, so run the added math before assuming one pays for itself.
Will my HOA allow solar panels?
In almost all cases, yes. Arizona law (A.R.S. § 33-1816) generally prohibits homeowners associations from outright banning solar panels, though HOAs can impose reasonable rules about placement and appearance (for example, requiring panels to be mounted in a way that's not visible from the street where feasible). Check your HOA's specific architectural guidelines before finalizing panel placement.
Does adding solar affect my homeowners insurance?
It can. Panels add replacement value to your home, and some insurers require you to notify them and adjust your dwelling coverage limit accordingly. A few policies also require a specific rider for solar equipment. Contact your insurance carrier before installation to confirm you're properly covered — and ask your installer for an itemized equipment value to make that conversation easier.
Does a bigger system always mean more savings in Arizona?
No — and this is where a lot of Arizona quotes miss the mark under net billing. Since exported power is credited at a fraction of the retail rate, oversizing a system beyond your household's actual consumption mostly generates power you're paid very little for. The better approach is sizing the system to your realistic annual usage plus a modest buffer, rather than maximizing panel count or production.
How do I know if my roof needs to be replaced before going solar?
Have a roofer (not just the solar installer) assess your roof's remaining service life before signing a solar contract. As a rule of thumb, if your roof has less than 10–15 years of remaining life, replacing it first is usually cheaper than paying to remove and reinstall panels later — a job that commonly runs $2,500–$5,000 depending on system size, on top of the roofing cost itself.
Can I take my solar system with me if I move?
No. A solar system is a fixed improvement to the home, and it stays with the property when you sell — you cannot relocate panels to your next house. If your system is leased, the lease also doesn't transfer to a new address; moving means either arranging for the buyer to assume the agreement, paying it off, or in some cases paying an early-termination cost, then starting a new agreement (if you go solar again) at your next home.
Meet Eric Ravenscroft, CRS
Eric Ravenscroft




Eric Ravenscroft built his career at the intersection of two disciplines that rarely sit in the same room: real estate and wealth management. Before founding The Ravenscroft Group, he spent years inside the financial planning world as an advisor, portfolio manager, and eventually a director of wealth management — work that trained him to think in opportunity cost, tax exposure, and long-term capital allocation long before he ever wrote a real estate offer. That background is why this guide reads less like a sales page and more like a financial memo: it's the same lens he brings to how a client should think about a solar contract, a 1031 exchange, or a short-term rental conversion.
Today, Eric leads The Ravenscroft Group with 15 years of combined experience across real estate and financial planning, and is recognized as a Top 1% REALTOR® across North America. He holds the Certified Residential Specialist (CRS) designation — awarded to a small percentage of agents nationwide based on production and continuing education — and carries Elite Agent status with Real Broker.









Eric's practice spans Phoenix-area new construction negotiations, master-planned communities such as Verrado, Estrella, Vistancia, Sterling Grove, Anthem, Palm Valley, and Ocotillo, short-term and mid-term rental strategy, 55+ active-adult relocations, and tax-efficient investment planning, including 1031 exchanges and bonus depreciation strategy for investors. He also leads The Ravenscroft Group's national relocation division, helping families move to Arizona from California, Washington, Oregon, Texas, Illinois, and beyond — supported by in-house tools including a cost-of-living comparison model and short-term rental income evaluations.
He writes and publishes original market analysis and financial-planning guides for Arizona homeowners and investors — like this one — because he believes clients make better decisions when they're shown the real numbers, not just the pitch.
Ready to talk through your specific numbers? Call or text +1 (480) 269-5858 or email eric@theravenscroftgroup.com.
Weighing solar against a future sale?
If you're considering solar — or already have it and are thinking about selling — let's run your specific numbers together before you commit to anything.
Talk to EricOr browse more financial and market guides on our blog.
Sources & Methodology
Data sources
- Arizona Corporation Commission — net billing / Resource Comparison Proxy rate filings (APS)
- Arizona Department of Revenue — property and sales tax exemption guidance for solar equipment
- APS and SRP published rate schedules and solar program documentation
- EnergySage Arizona and Phoenix-metro solar cost data, 2026
- U.S. Energy Information Administration household electricity usage data
Figures in this guide are statewide and metro averages current as of the last-reviewed date above. Your actual costs, usage, and savings will vary by home, utility rate plan, and installer. Investment return assumptions (7%) are illustrative and not a projection or guarantee.
Categories
- All Blogs (321)
- Active Adult & 55 Plus Communities (16)
- Arizona Relocation Guides (30)
- Buyers (211)
- Financial Planning (60)
- General Real Estate (139)
- Income From Real Estate (59)
- Market Update (26)
- New Construction (28)
- News, Updates and Coming Soon (57)
- Real Estate Agent Financial Planning (22)
- Real Estate Investing (94)
- Sellers (106)
- Vacation and Short Term Rentals (45)
Recent Posts







About the Author
Eric Ravenscroft is a Top 1% REALTOR® across North America and one of Arizona’s most trusted real estate strategists. With 15 years of experience spanning real estate, wealth management, and investment planning, he helps clients make smarter, financially grounded decisions, from new construction and relocations to STR investments, 1031 exchanges, and long-term portfolio strategy.
Eric’s expertise has earned him industry recognition, Elite status with Real Broker, and features in major publications including the Wall Street Journal, MarketWatch, MSN, and Morningstar. Clients across the Greater Phoenix Metro rely on his clarity, strategic insight, and results-driven guidance.
Ready to make a confident real estate move? Call or text Eric today.